Origin Bancorp, Inc. Reports Earnings for Second Quarter 2023
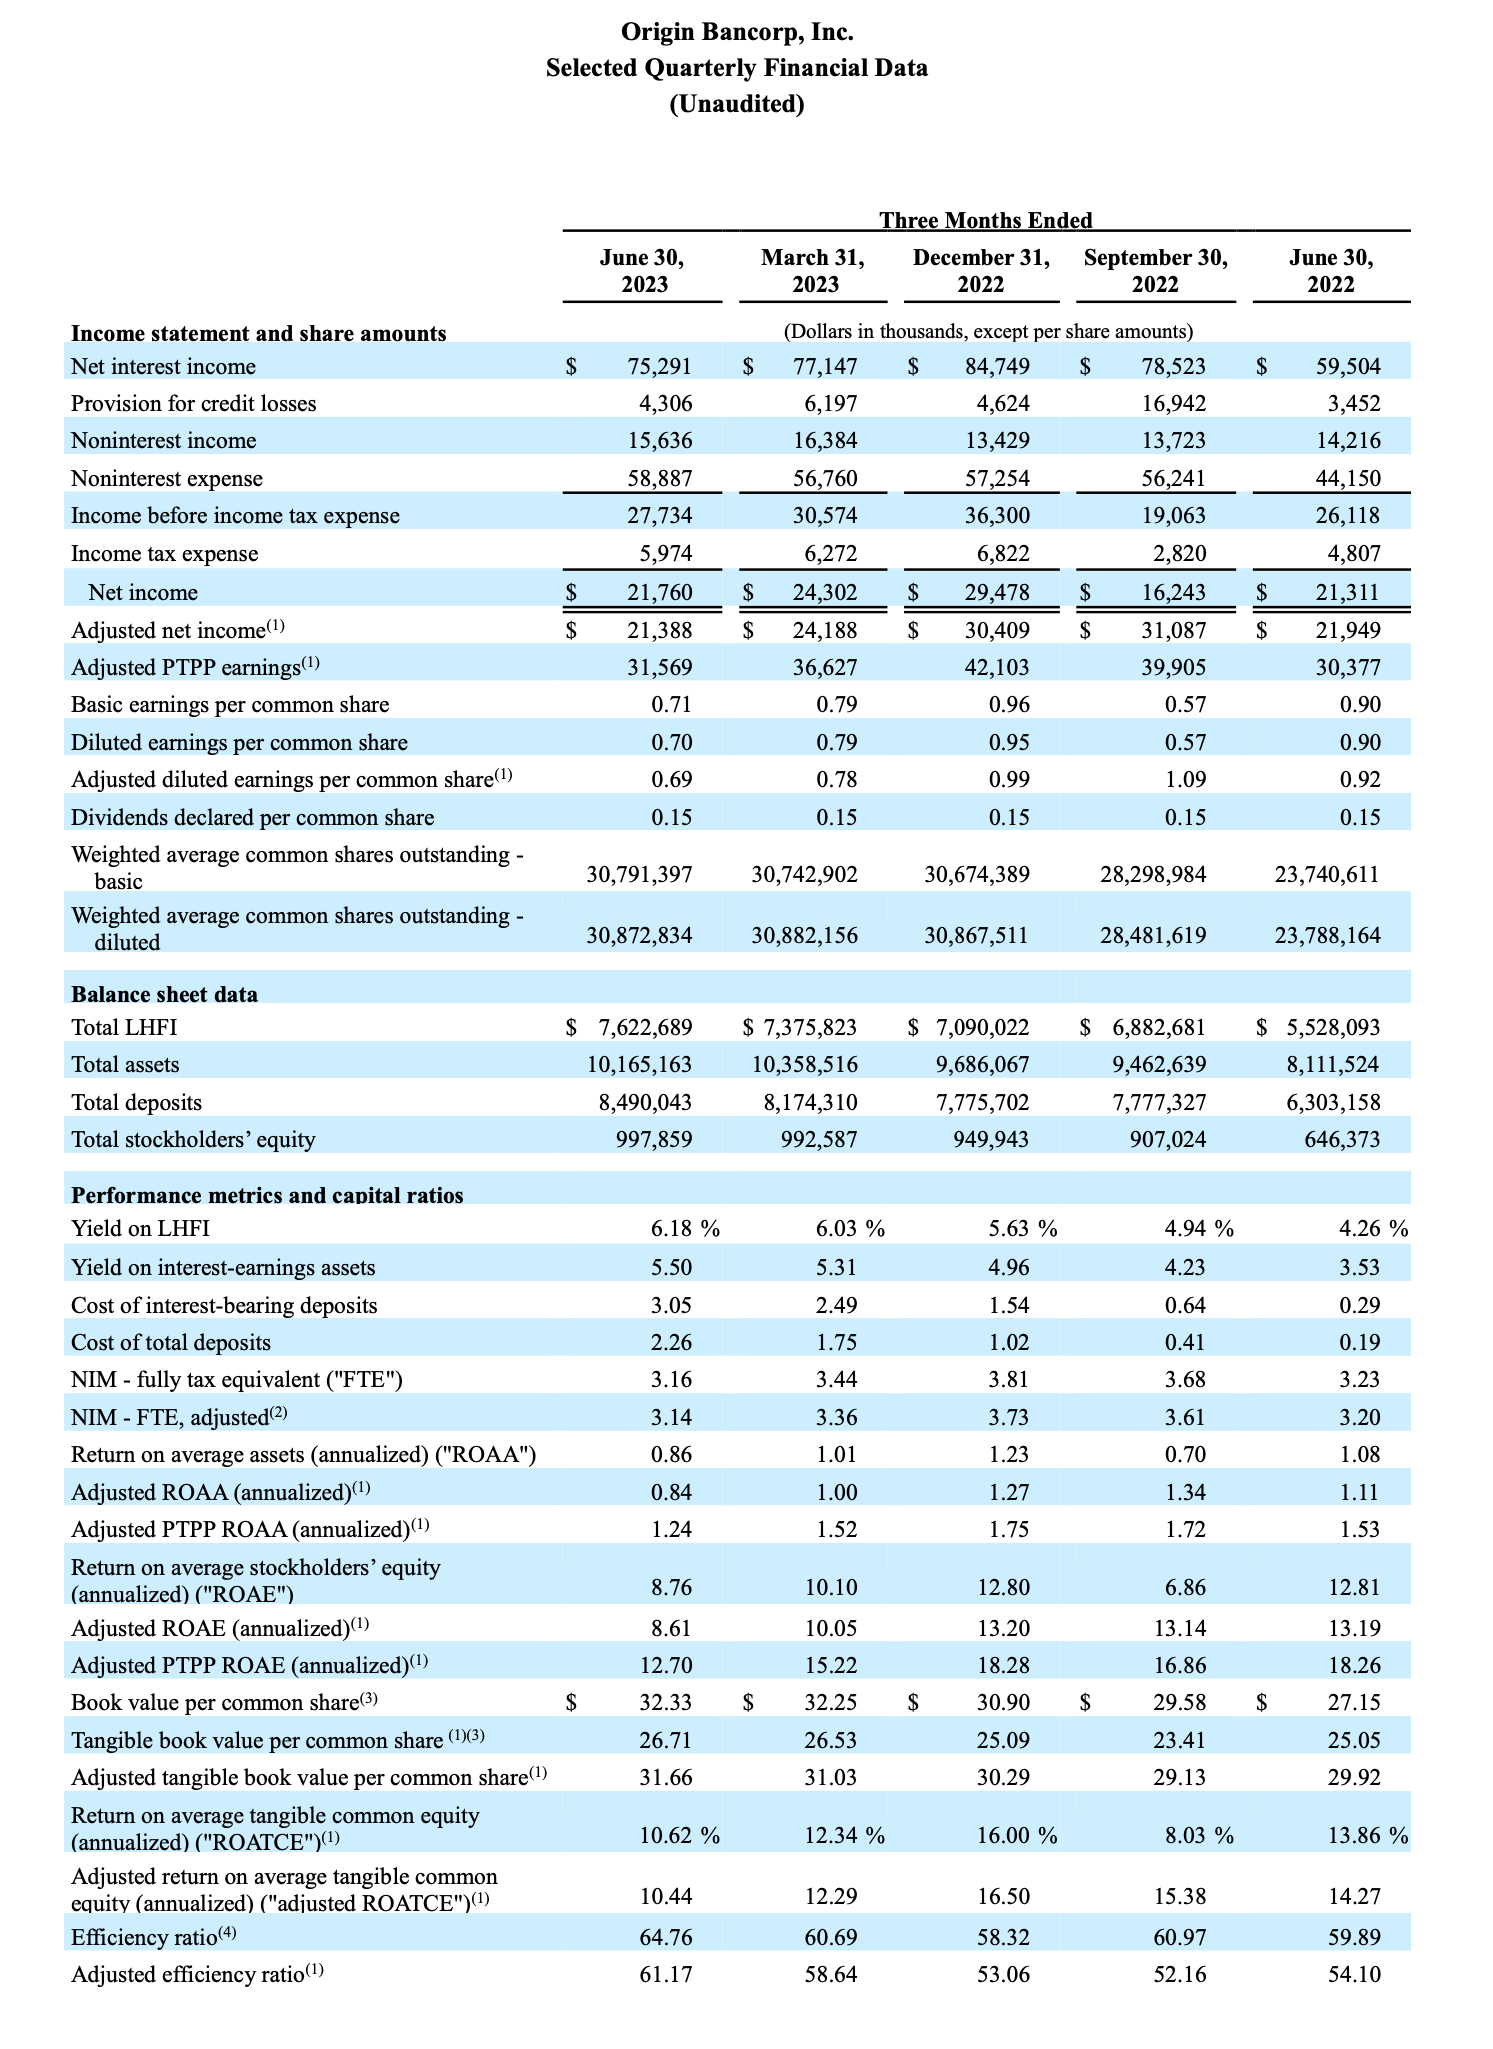
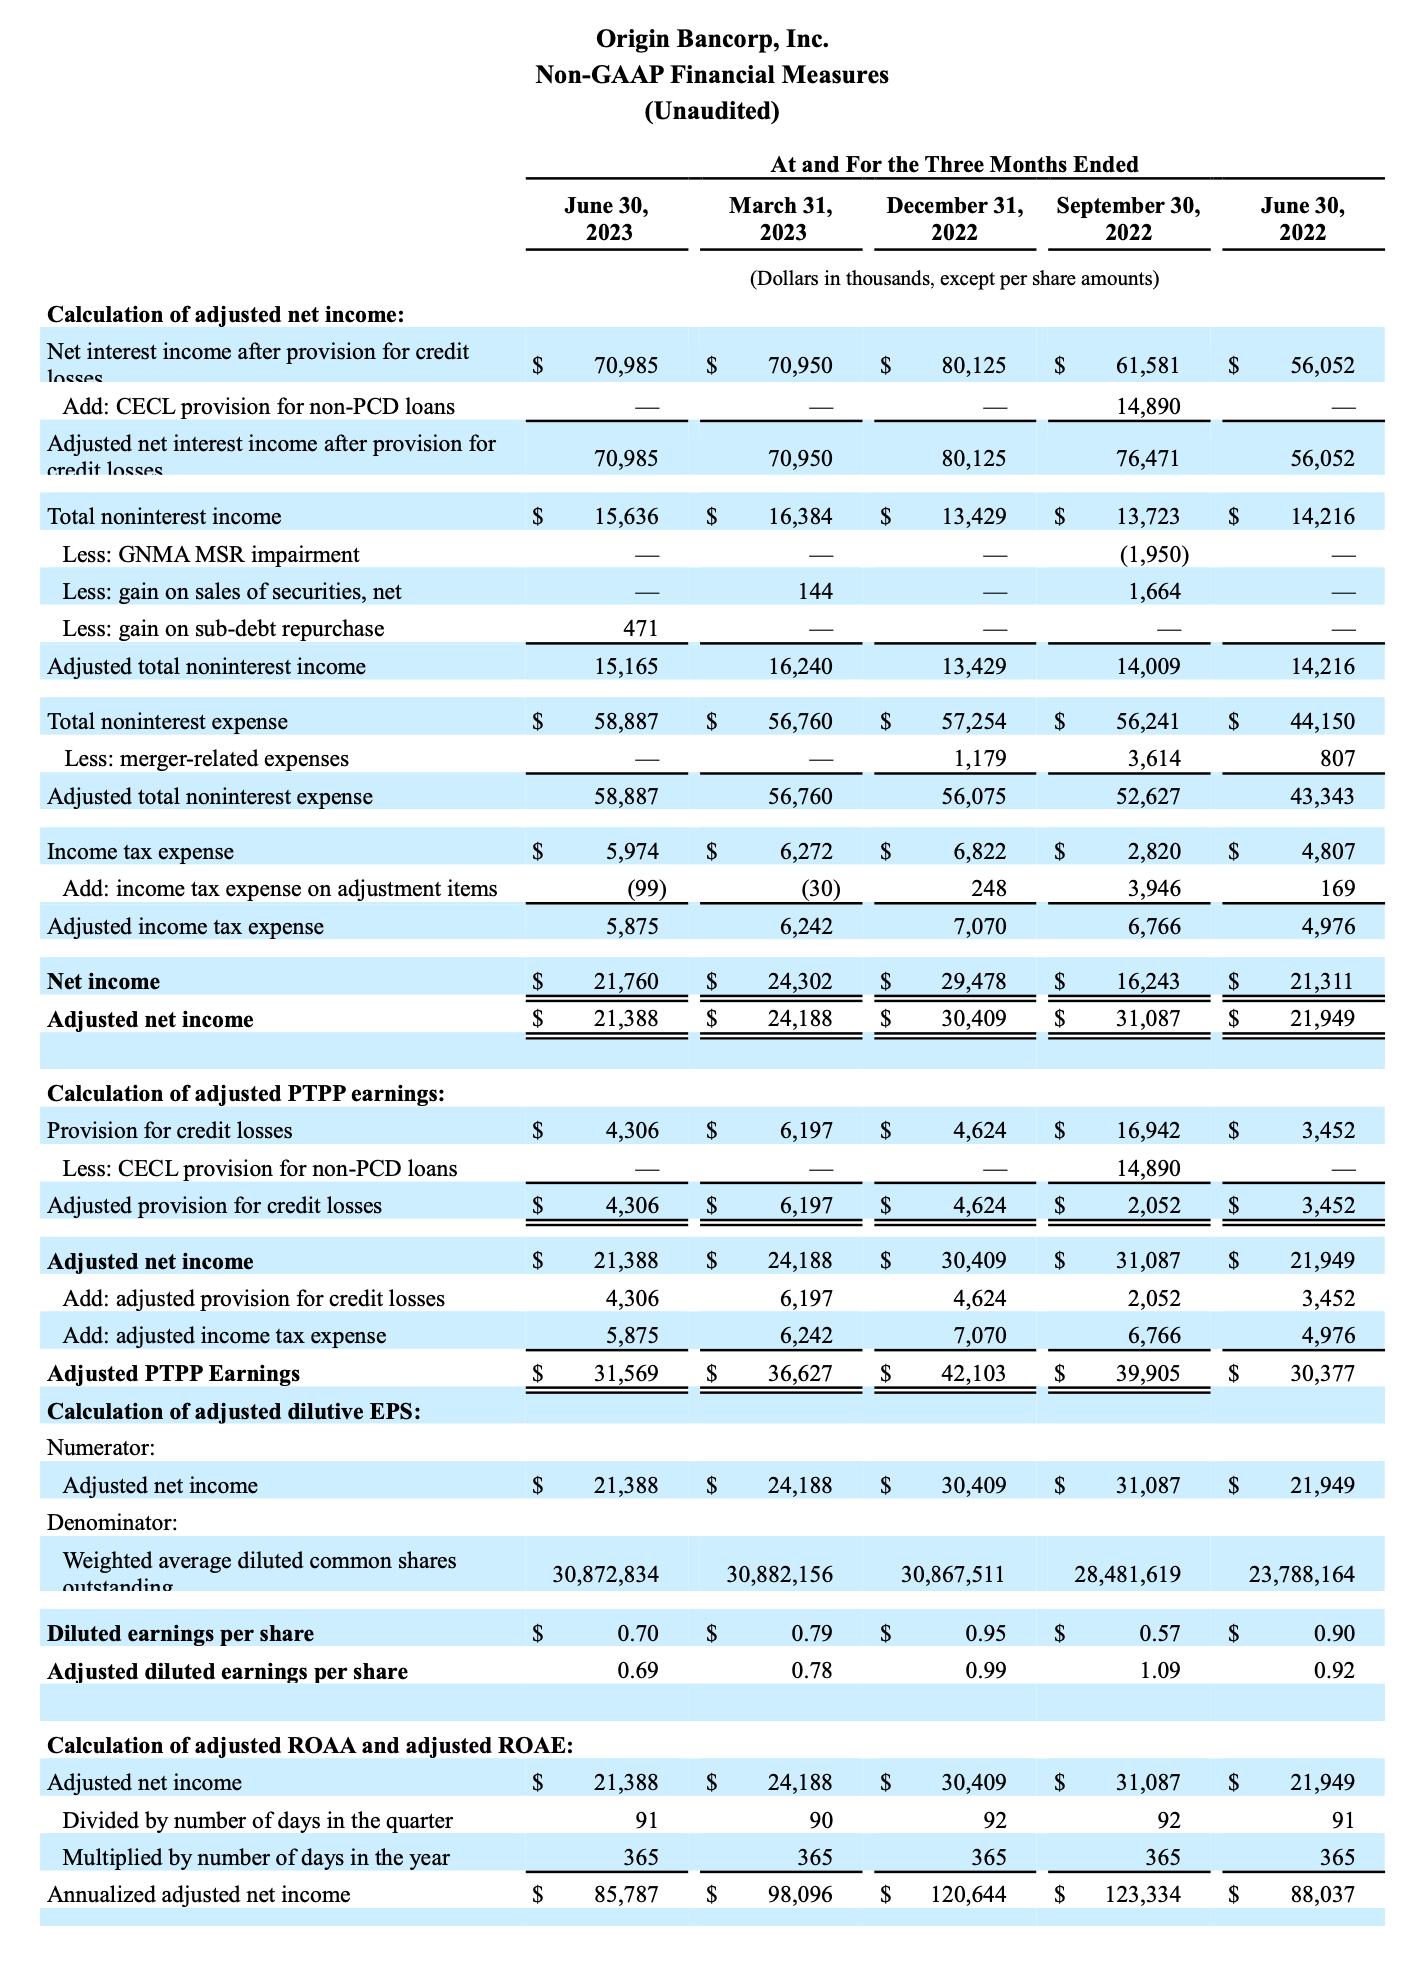
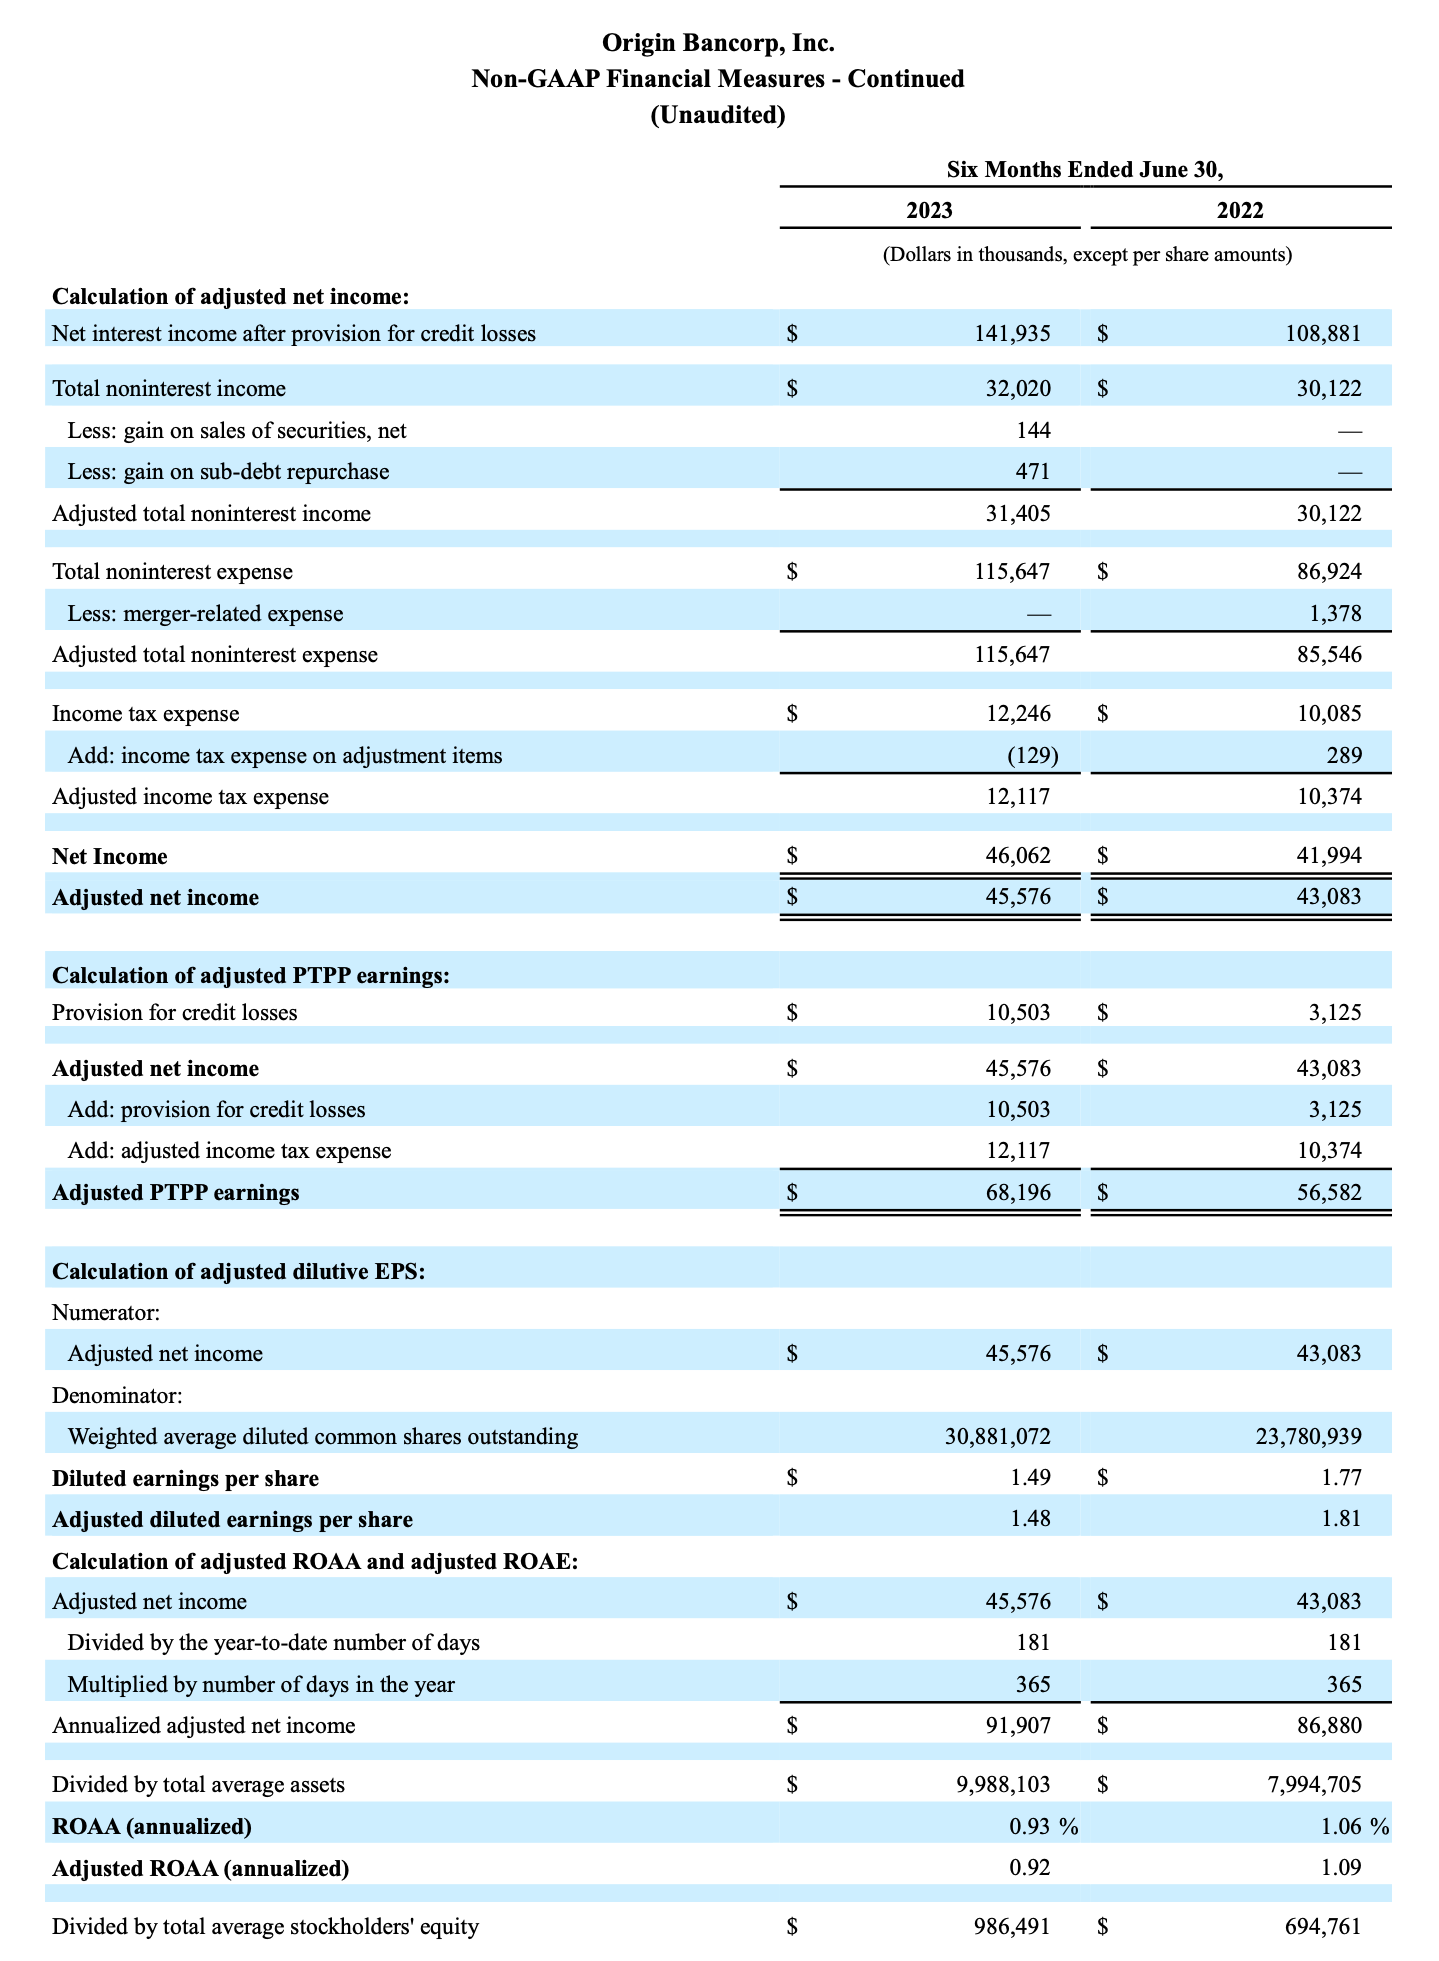
Origin Bancorp, Inc. (NYSE: OBK) (“Origin” or the “Company”), the holding company for Origin Bank (the “Bank”), today announced net income of $21.8 million, or $0.70 diluted earnings per share for the quarter ended June 30, 2023, compared to net income of $24.3 million, or $0.79 diluted earnings per share, for the quarter ended March 31, 2023. Adjusted pre-tax, pre-provision ("adjusted PTPP")(1) earnings were $31.6 million, for the quarter ended June 30, 2023.
“As we enter the second half of the year, Origin is operating from a position of strength as we continue to execute on our long-term strategy,” said Drake Mills, chairman, president and CEO of Origin Bancorp, Inc. “While we are mindful of the challenges facing the entire industry, this company has proven that we can maximize the opportunities before us, and come out of economic cycles a stronger, more efficient company.”
(1) Adjusted PTPP earnings is a non-GAAP financial measure, please see the last few pages of this document for a reconciliation of this alternative financial measure to its comparable GAAP measure.
Financial Highlights
• Total loans held for investment ("LHFI"), excluding mortgage warehouse lines of credit, were $7.09 billion at June 30, 2023, reflecting an increase of $46.8 million, or 0.7%, compared to March 31, 2023.
• Total deposits were $8.49 billion at June 30, 2023, reflecting an increase of $315.7 million, or 3.9%, compared to March 31, 2023.
• Net interest income was $75.3 million for the quarter ended June 30, 2023, reflecting a decrease of $1.9 million, or 2.4%, compared to the linked quarter.
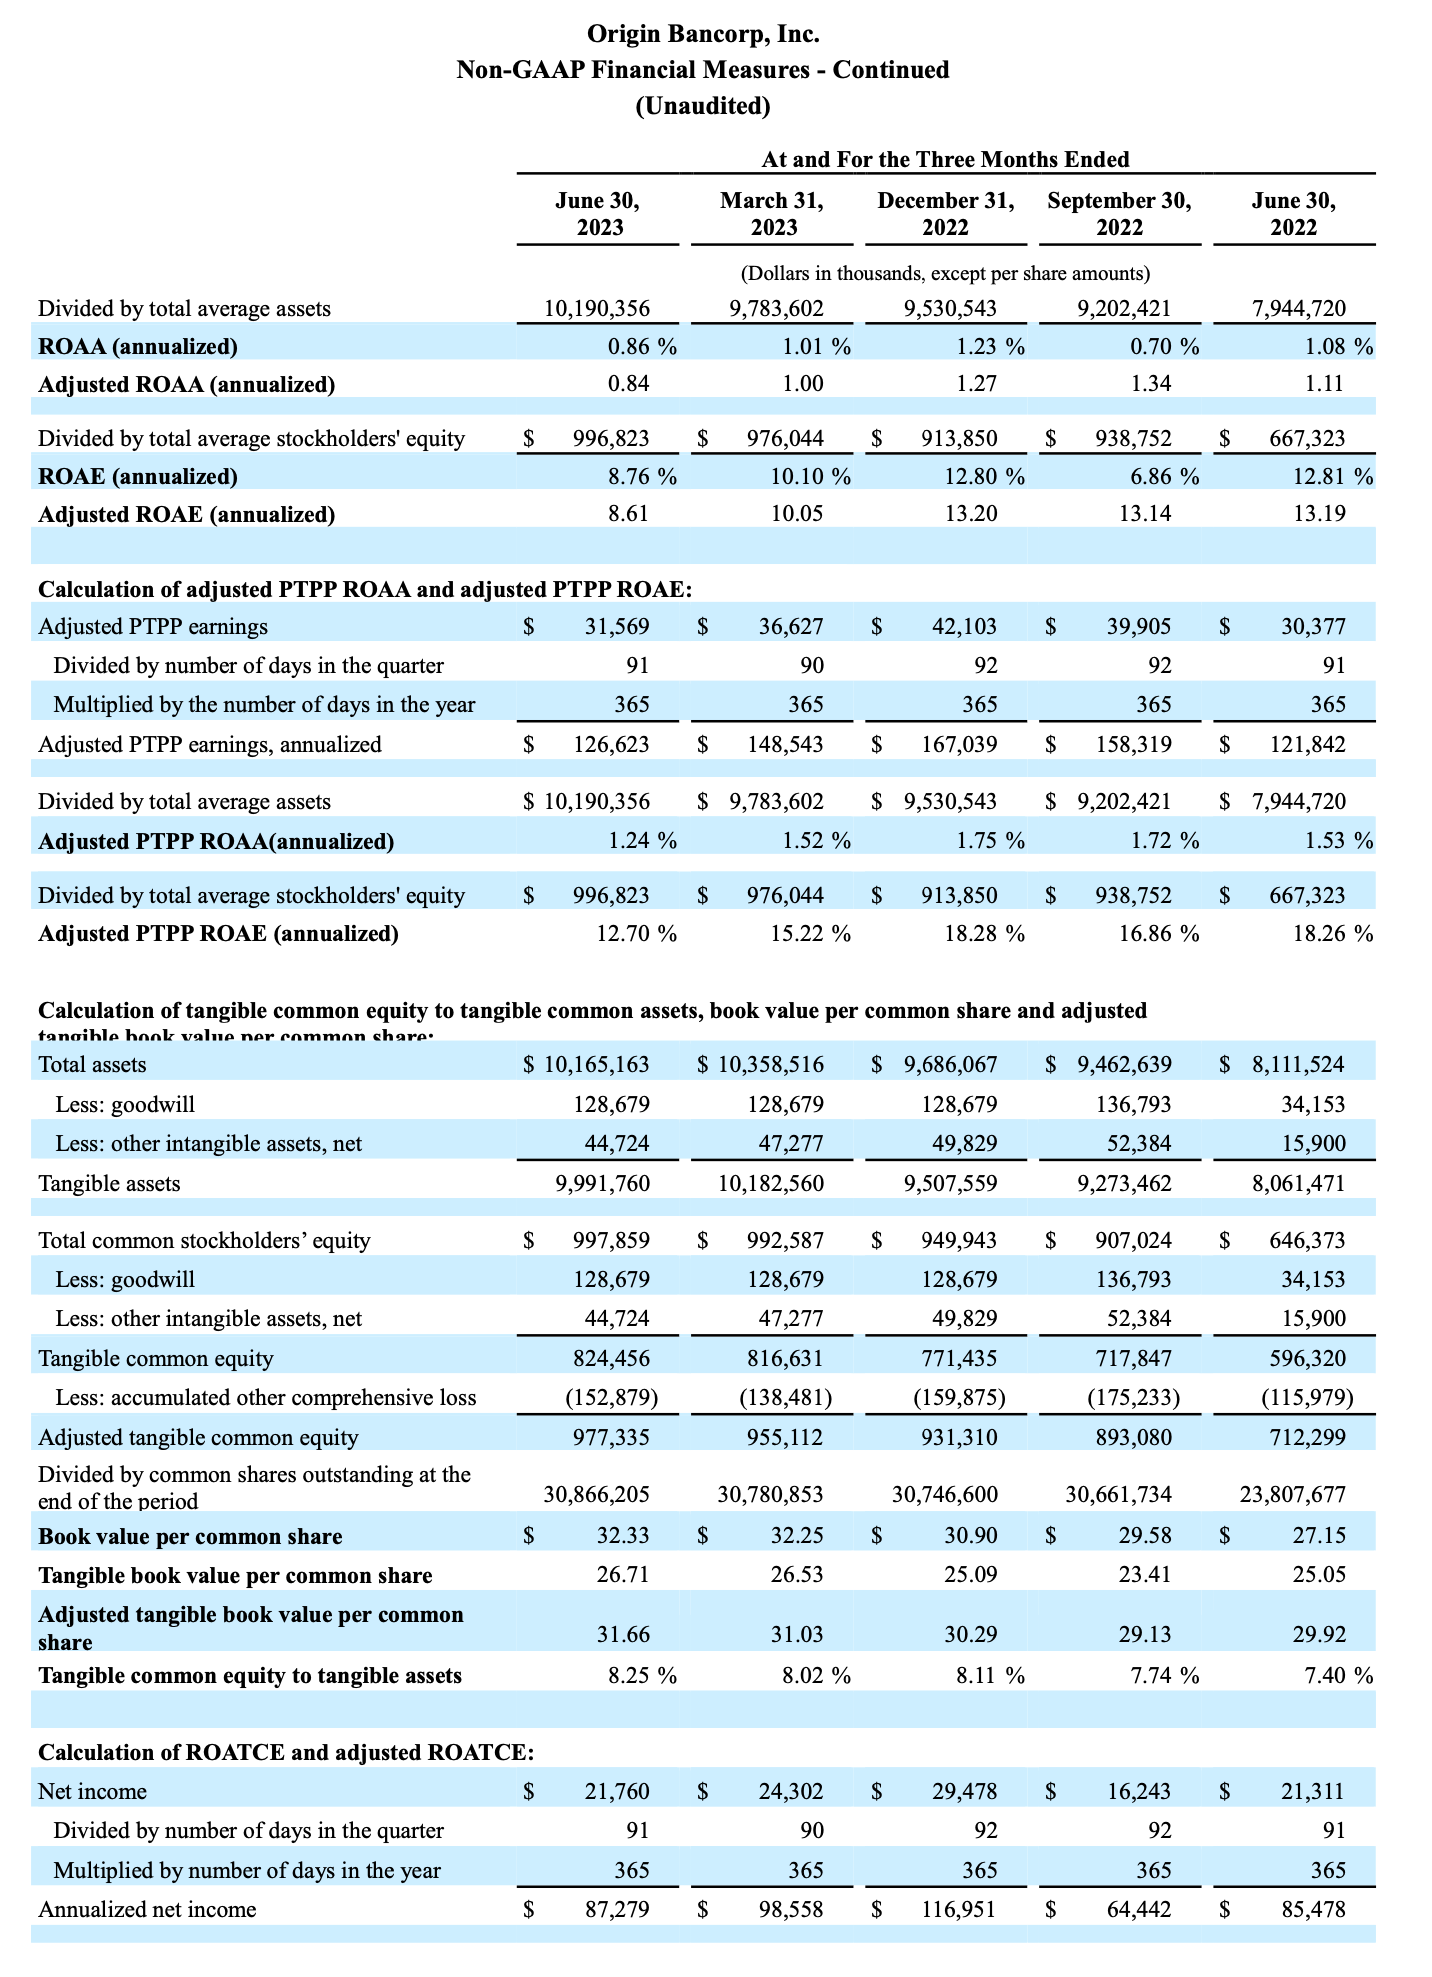
• Book value per common share was $32.33 at June 30, 2023, reflecting an increase of $0.08, or 0.2%, compared to the linked quarter. Tangible book value per common share(1) was $26.71 at June 30, 2023, reflecting an increase of $0.18, or 0.7%, compared to the linked quarter.
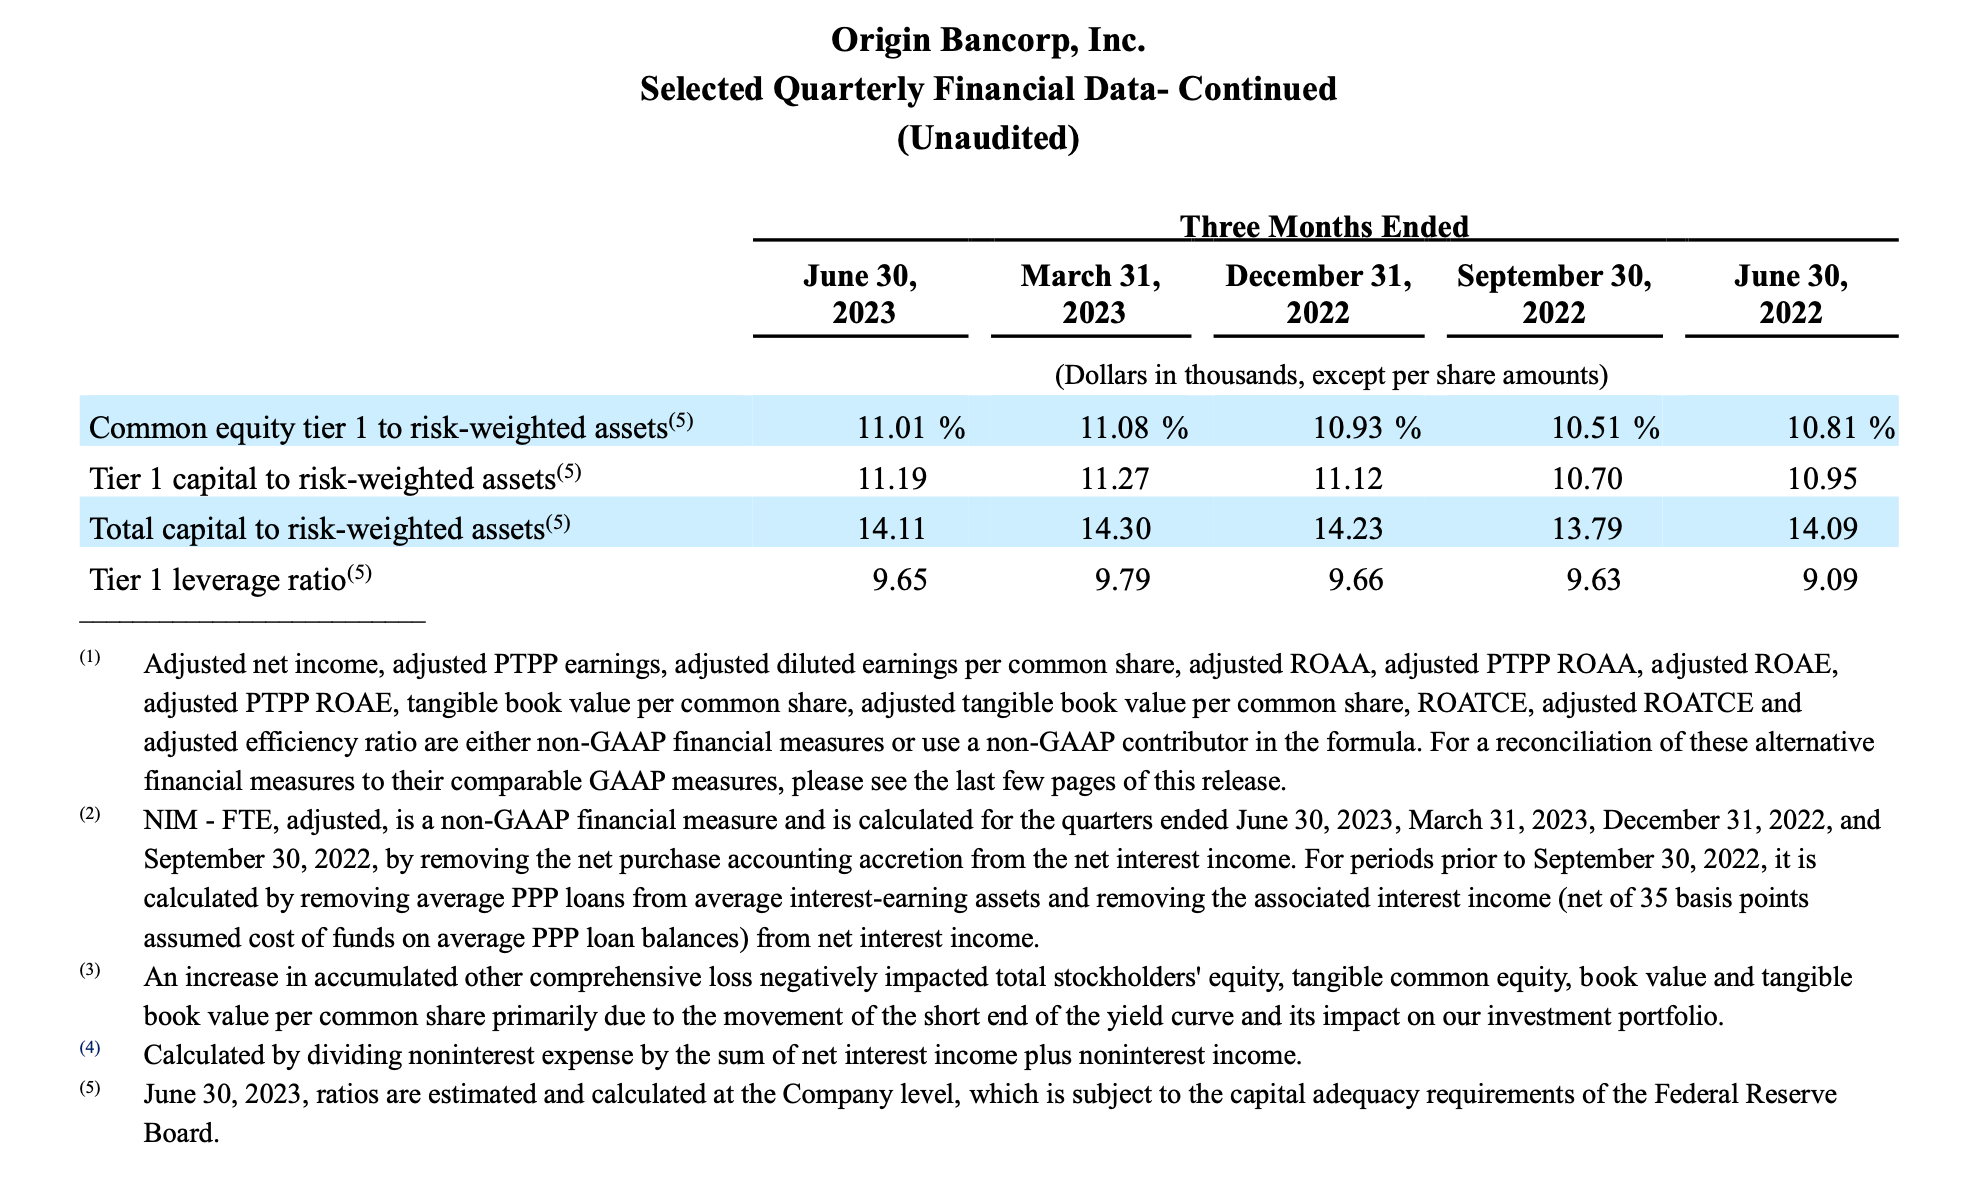
• At June 30, 2023, and March 31, 2023, Company level common equity Tier 1 capital to risk-weighted assets was 11.01%, and 11.08%, respectively, the Tier 1 leverage ratio was 9.65% and 9.79%, respectively, and the total capital ratio was 14.11% and 14.30%, respectively. Tangible common equity to tangible assets(1) was 8.25% at June 30, 2023, compared to 8.02% at March 31, 2023.
• LHFI, excluding mortgage warehouse lines of credit, to deposits were 83.5% at June 30, 2023, compared to 86.1% at March 31, 2023. Cash and liquid securities as a percentage of total assets was 11.1% at June 30, 2023, compared to 14.3% at March 31, 2023.
(1) Tangible book value per common share and tangible common equity to tangible assets are non-GAAP financial measures. Please see the last few pages of this document for a reconciliation of these alternative financial measures to their comparable GAAP measures.
Results of Operations for the Three Months Ended June 30, 2023
Net Interest Income and Net Interest Margin
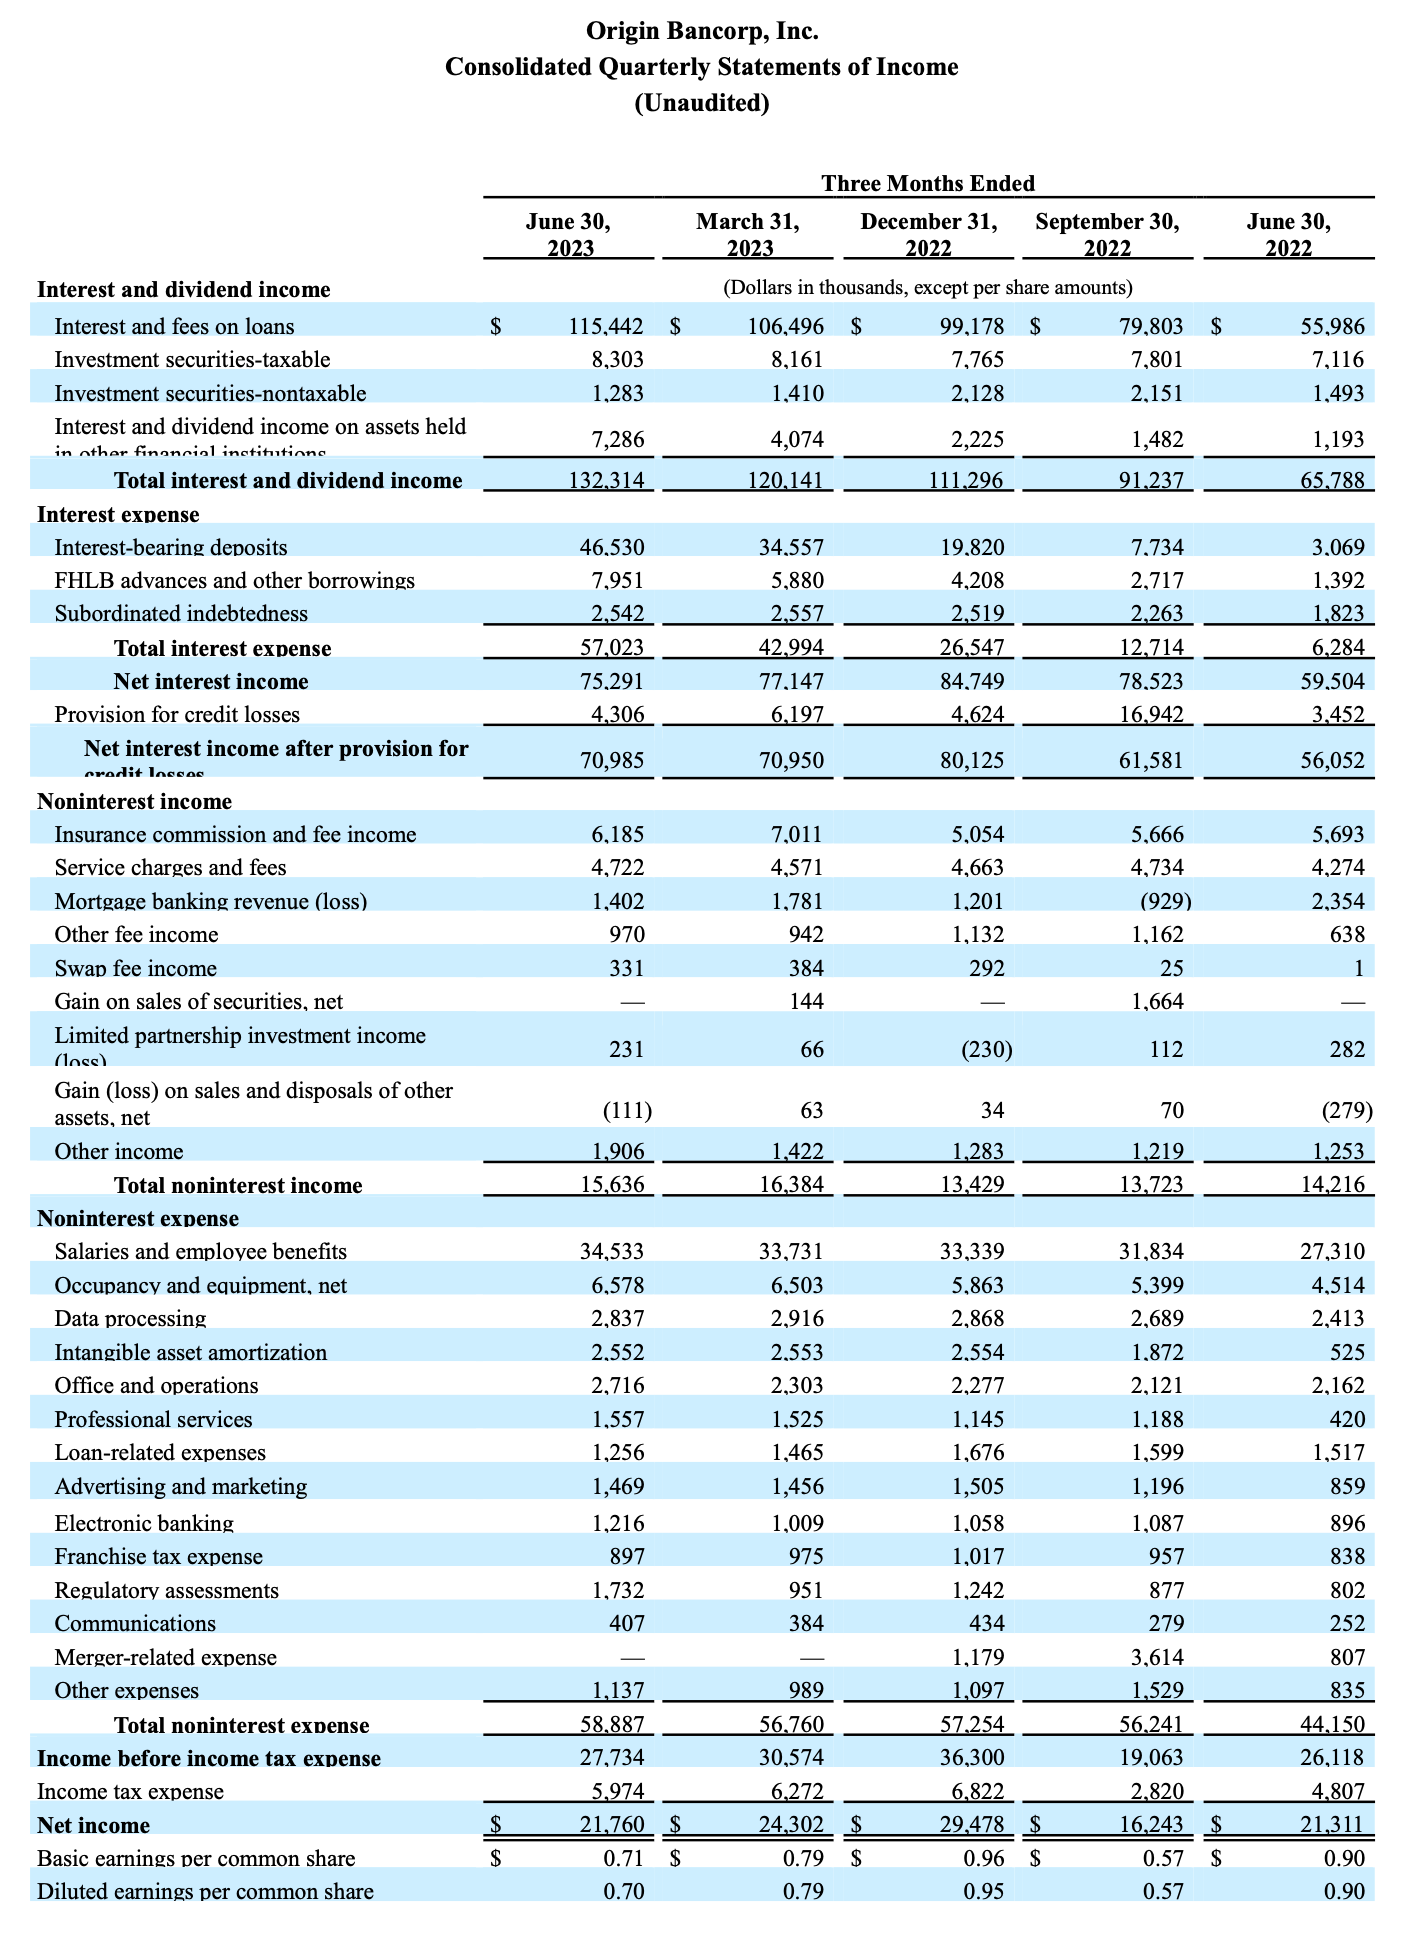
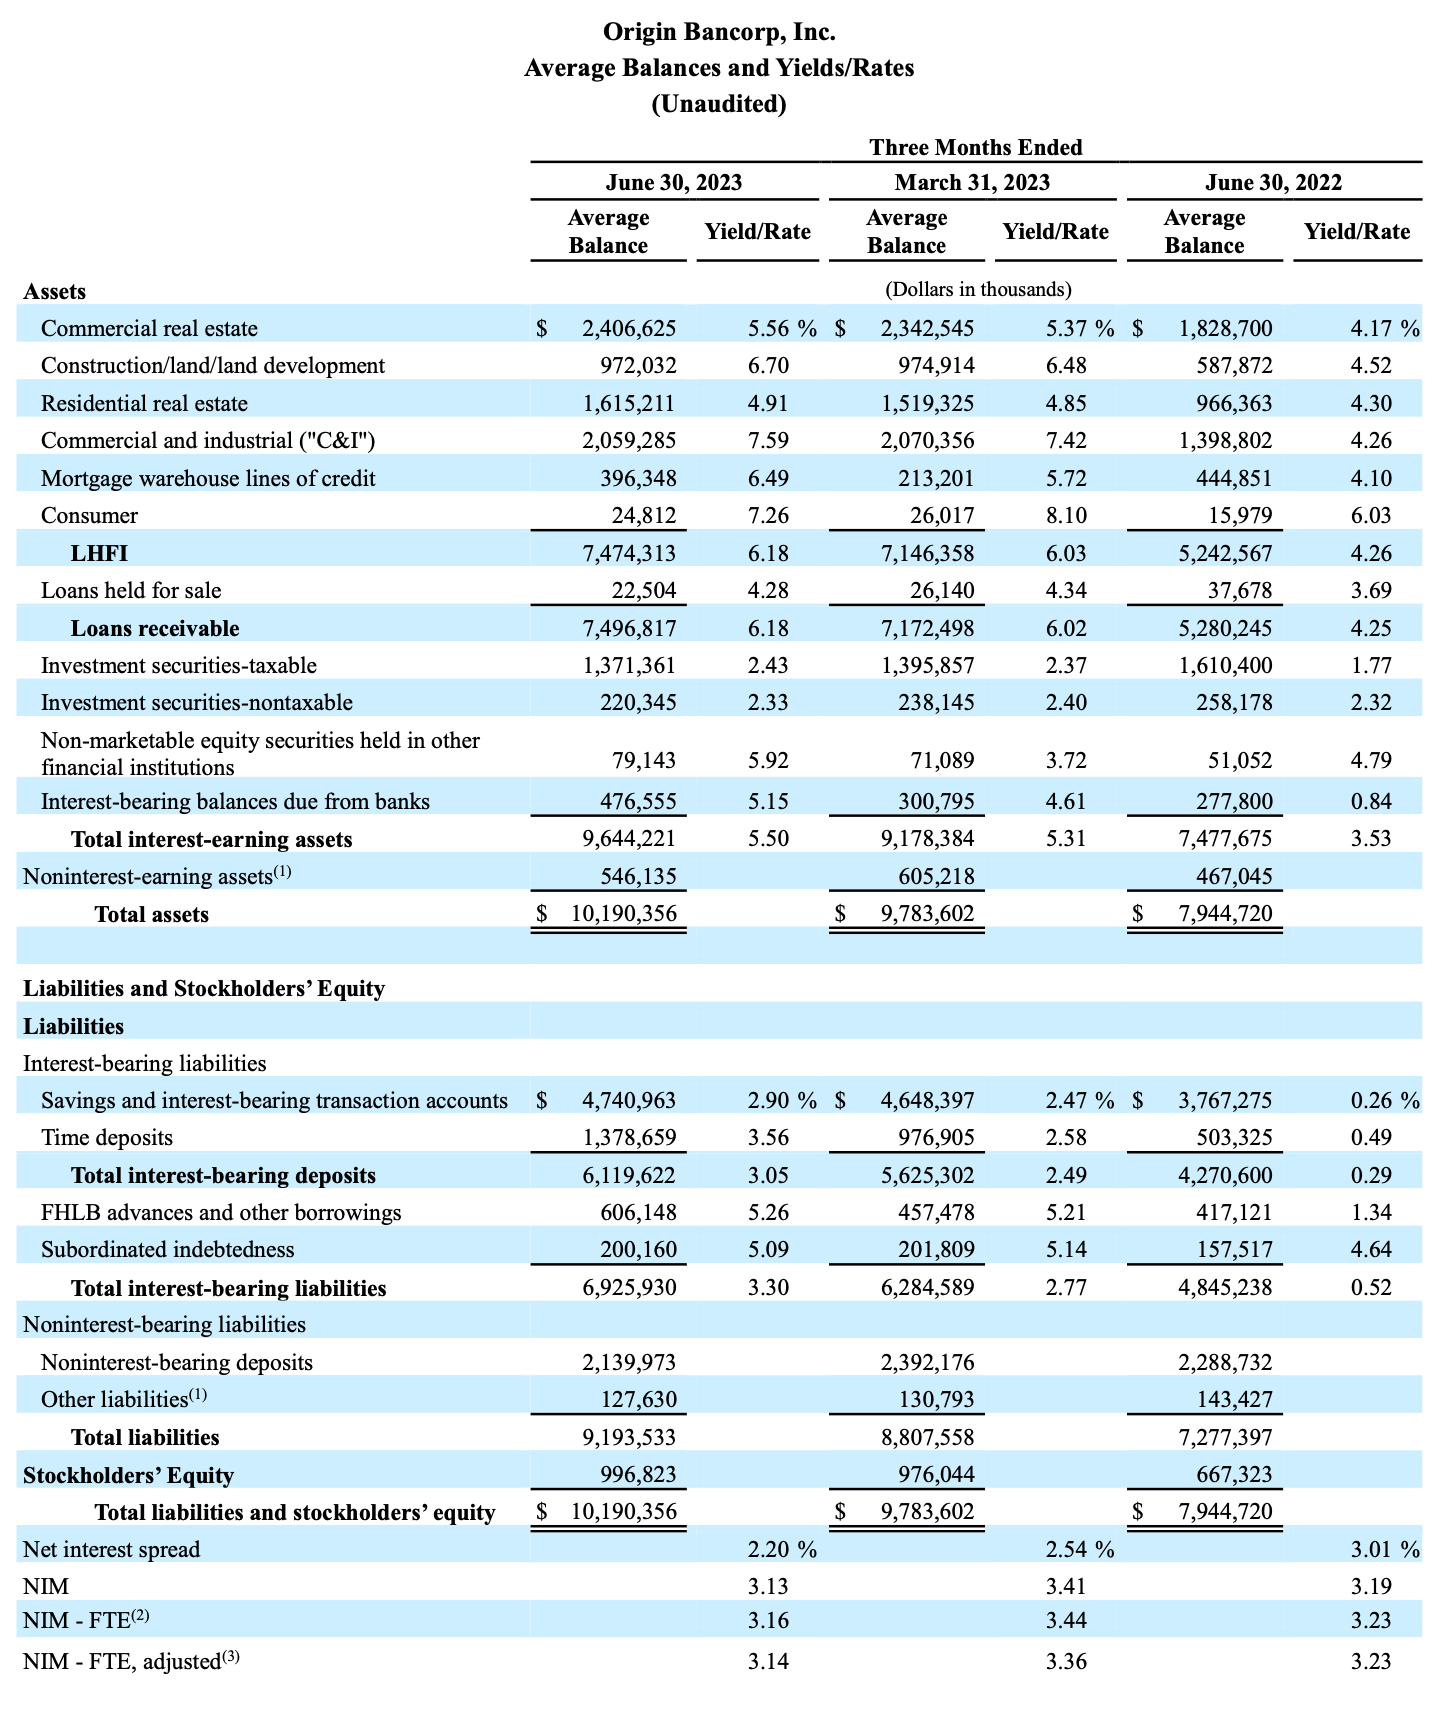
Net interest income for the quarter ended June 30, 2023, was $75.3 million, a decrease of $1.9 million, or 2.4%, compared to the linked quarter, due primarily to a $14.0 million increase in total interest expense, partially offset by a $12.2 million increase in total interest income. Increases in interest rates drove an $8.9 million increase in total deposit interest expense, and higher average interest-bearing deposit balances drove another $3.1 million increase in total deposit interest expense, primarily due to higher average brokered and time deposit balances. An additional $1.9 million increase in total interest expense was due to higher average balances of FHLB advances and other borrowings during the current quarter compared to the linked quarter. Increases in average interest-earning asset balances drove a $6.1 million increase in total interest income, of which $4.3 million was due to higher average LHFI balances, while increases in interest rates on average interest-earning assets drove another $6.1 million increase in total interest income, of which $4.7 million was due to higher interest rates on LHFI.
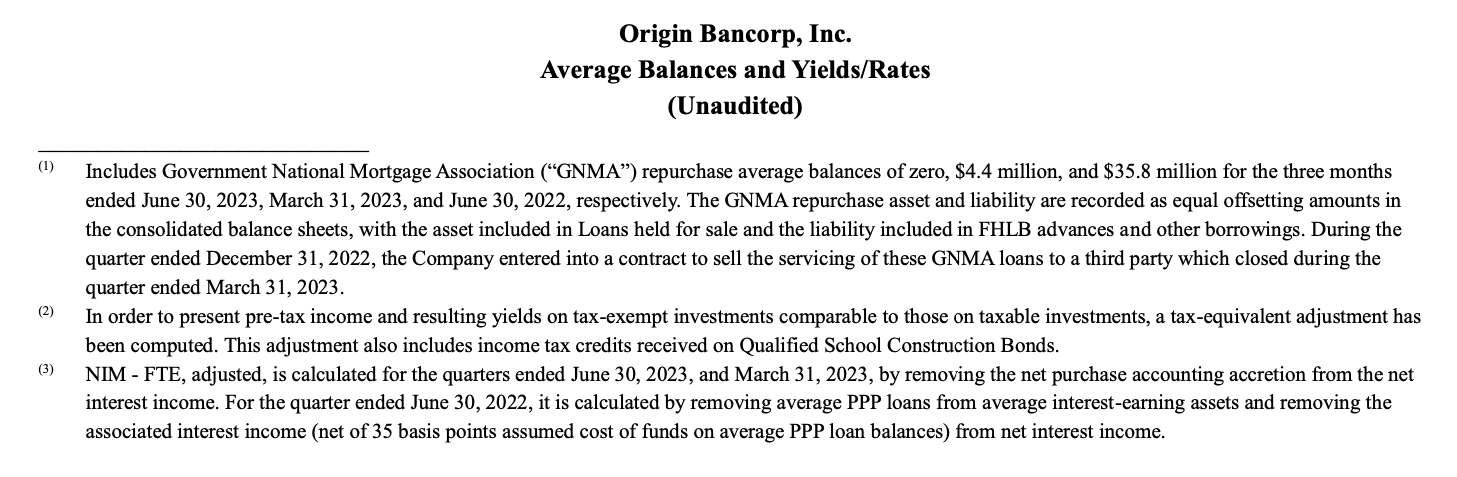
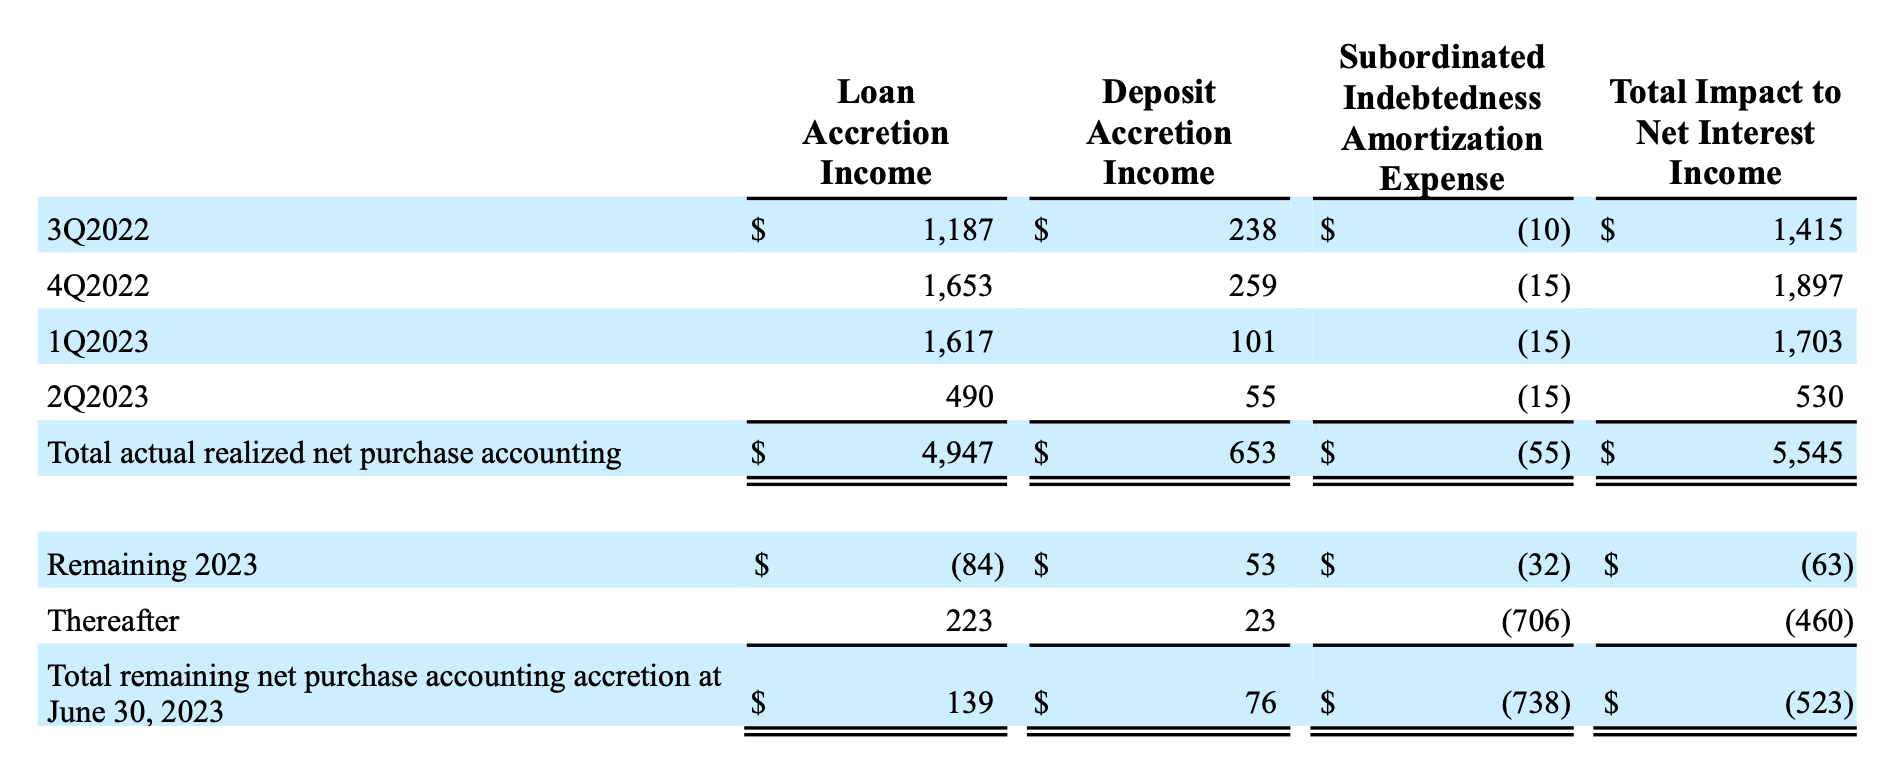
The net purchase accounting accretion declined to $530,000, a decrease of $1.2 million, for the three months ended June 30, 2023, compared to the three months ended March 31, 2023. The table below presents the estimated loan and deposit accretion and subordinated indebtedness amortization resulting from merger purchase accounting adjustments for the periods shown.
The Federal Reserve Board sets various benchmark rates, including the Federal Funds rate, and thereby influences the general market rates of interest, including the loan and deposit rates offered by financial institutions. On March 17, 2022, the Federal Reserve began an aggressive campaign to combat inflation with its first target rate range increase to 0.25% to 0.50%. Subsequently, it increased the target range six more times during 2022 and three more times during 2023, with the most recent and current Federal Funds target rate range being set on May 3, 2023, at 5.00% to 5.25%. By June 30, 2023, the Federal Funds target rate range had increased 475 basis points from March 17, 2022, and in order to remain competitive as market interest rates increased, we increased interest rates paid on our deposits.
The average rate on interest-bearing deposits increased to 3.05% for the quarter ended June 30, 2023, compared to 2.49% for the quarter ended March 31, 2023. The average interest-bearing deposit balances increased $494.3 million to $6.12 billion for the quarter ended June 30, 2023, from $5.63 billion for the linked quarter, of which $317.7 million and $84.1 million, respectively, were driven by higher average brokered and non-brokered time deposit balances. The average noninterest- bearing deposit balances declined $252.2 million during the quarter ended June 30, 2023, as depositors sought out safety in the form of FDIC insurance-covered balances and higher yielding investments amid increasing interest rates in the marketplace.
The average rate on FHLB advances and other borrowings increased to 5.26% for the quarter ended June 30, 2023, compared to 5.21% for the linked quarter. Additionally, the yield on LHFI was 6.18% and 6.03% for the quarter ended June 30, 2023, and March 31, 2023, respectively, and average LHFI balances increased to $7.47 billion for the quarter ended June 30, 2023, compared to $7.15 billion for the linked quarter. The yield on LHFI, excluding the purchase accounting accretion, was 6.16% for the quarter ended June 30, 2023, compared to 5.94% for the linked quarter.
During March 2023, the Company made a strategic decision to borrow and hold approximately $700.0 million of excess cash for contingency liquidity for the majority of the quarter ended June 30, 2023. As of June 30, 2023, the Company repaid the excess contingency liquidity. The excess liquidity was held at a weighted-average rate of 5.17% and added $368.7 million in average interest-bearing assets for the quarter ended June 30, 2023, which negatively impacted the fully tax- equivalent net interest margin (“NIM”) by 12 basis points.
The fully tax-equivalent NIM was impacted by margin compression as rates on interest-bearing liabilities rose faster than yields on interest-earning assets during the last three quarters. The fully tax-equivalent NIM was 3.16% for the quarter ended June 30, 2023, a 28 and a 7 basis point decrease compared to the linked quarter and the prior year same quarter, respectively. The yield earned on interest-earning assets for the quarter ended June 30, 2023, was 5.50%, an increase of 19 and 197 basis points compared to the linked quarter and the prior year same quarter, respectively. The average rate paid on total deposits for the quarter ended June 30, 2023, was 2.26%, representing a 51 and a 207 basis point increase compared to the linked quarter and the prior year same quarter, respectively. The average rate paid on FHLB and other borrowings also increased to 5.26%, reflecting a 5 and a 392 basis point increase compared to the linked quarter and prior year same quarter, respectively. The net increase in accretion income due to the BT Holdings, Inc. (“BTH”) merger increased the fully tax- equivalent NIM by approximately two and eight basis points for the current quarter and the linked quarter, respectively.
Credit Quality
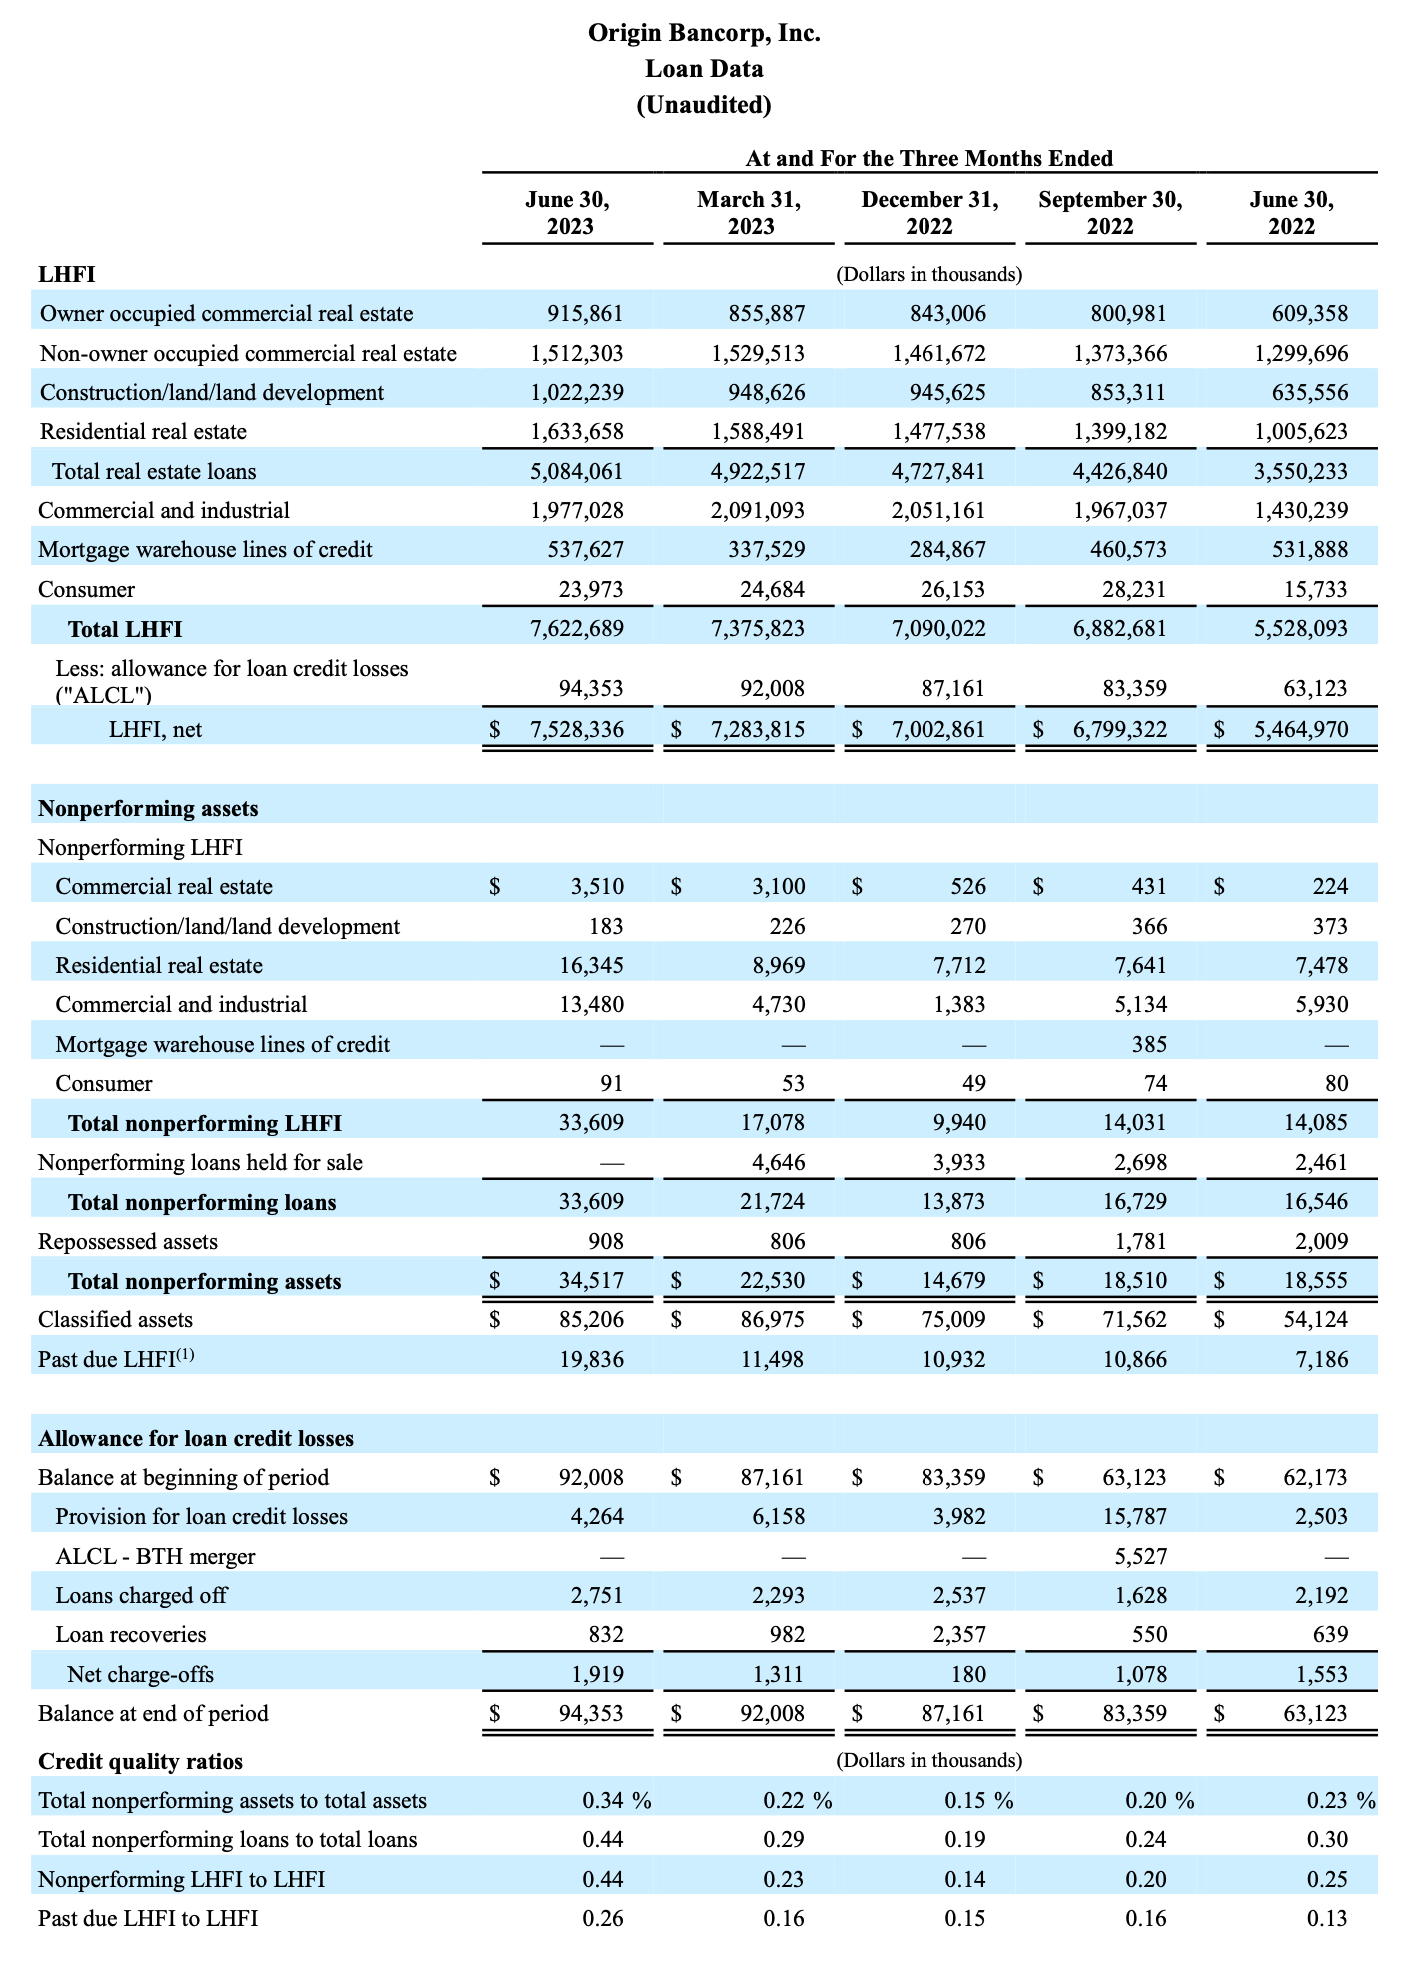
The table below includes key credit quality information:
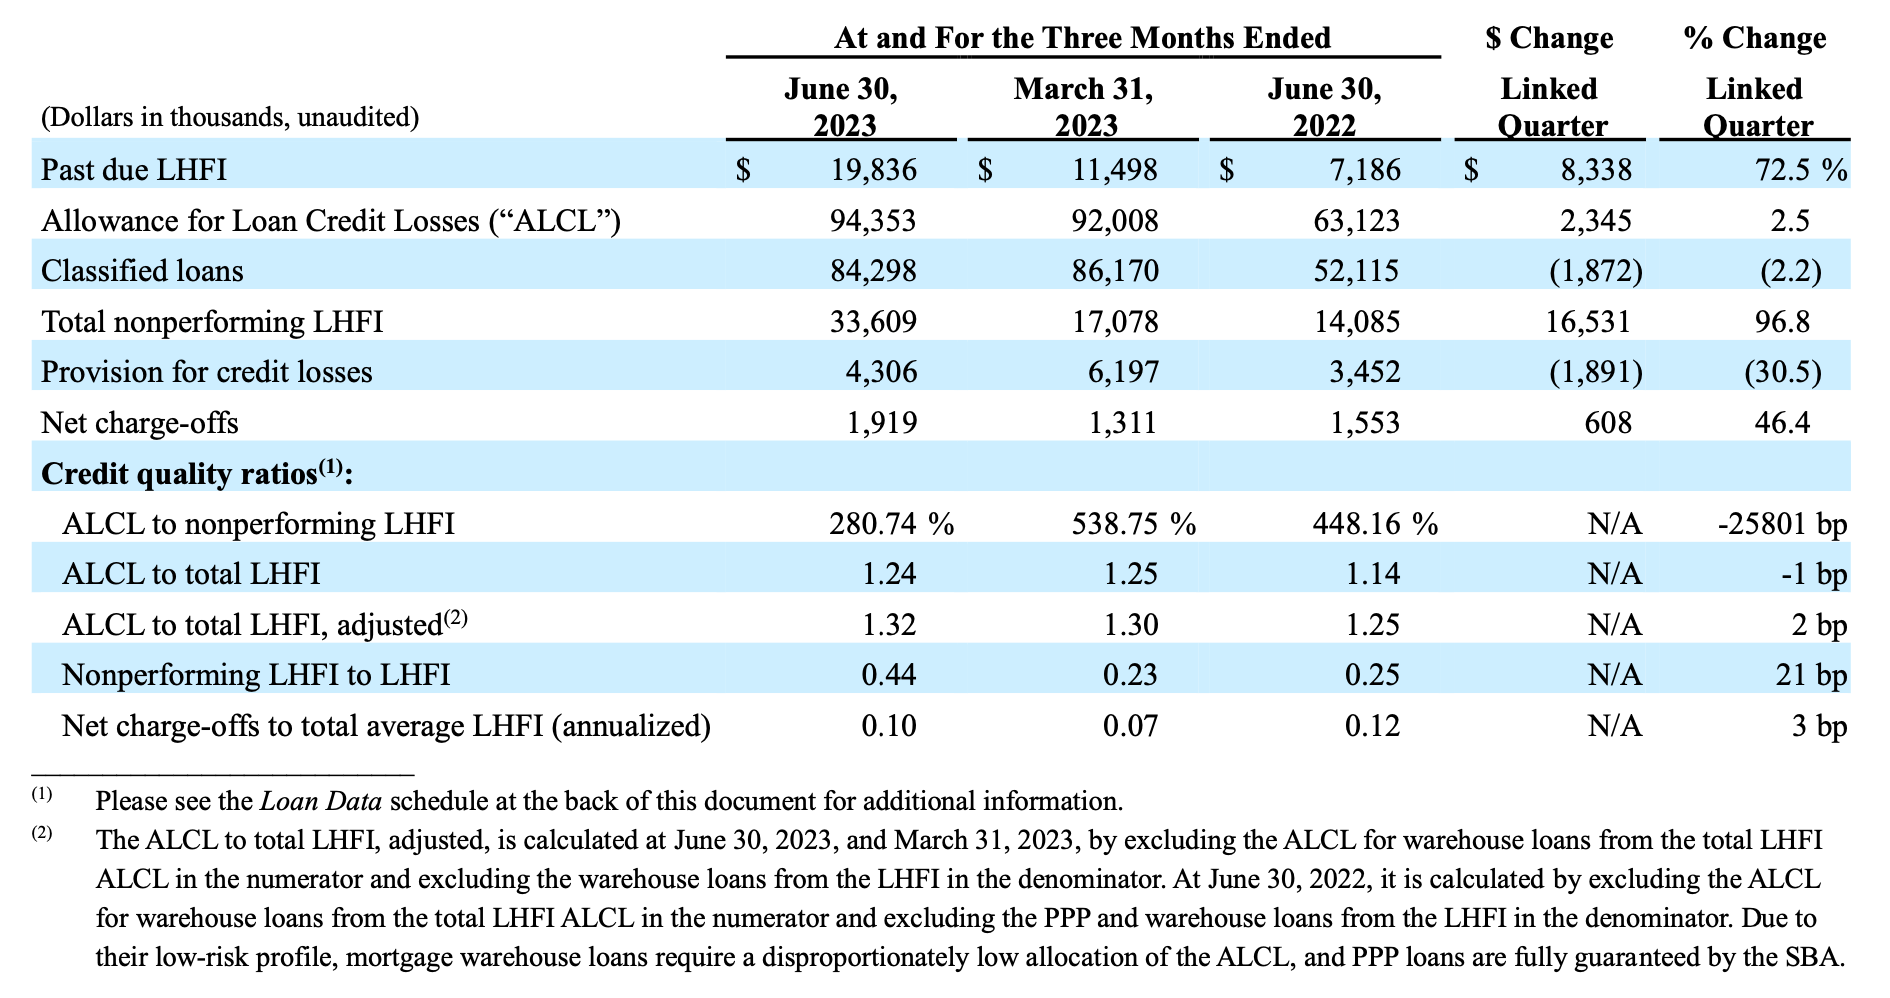
The Company recorded a credit loss provision of $4.3 million during the quarter ended June 30, 2023, compared to $6.2 million recorded during the linked quarter. The decrease is primarily due to lower loan growth, exclusive of mortgage warehouse lines of credit, during the quarter ended June 30, 2023, compared to March 31, 2023.
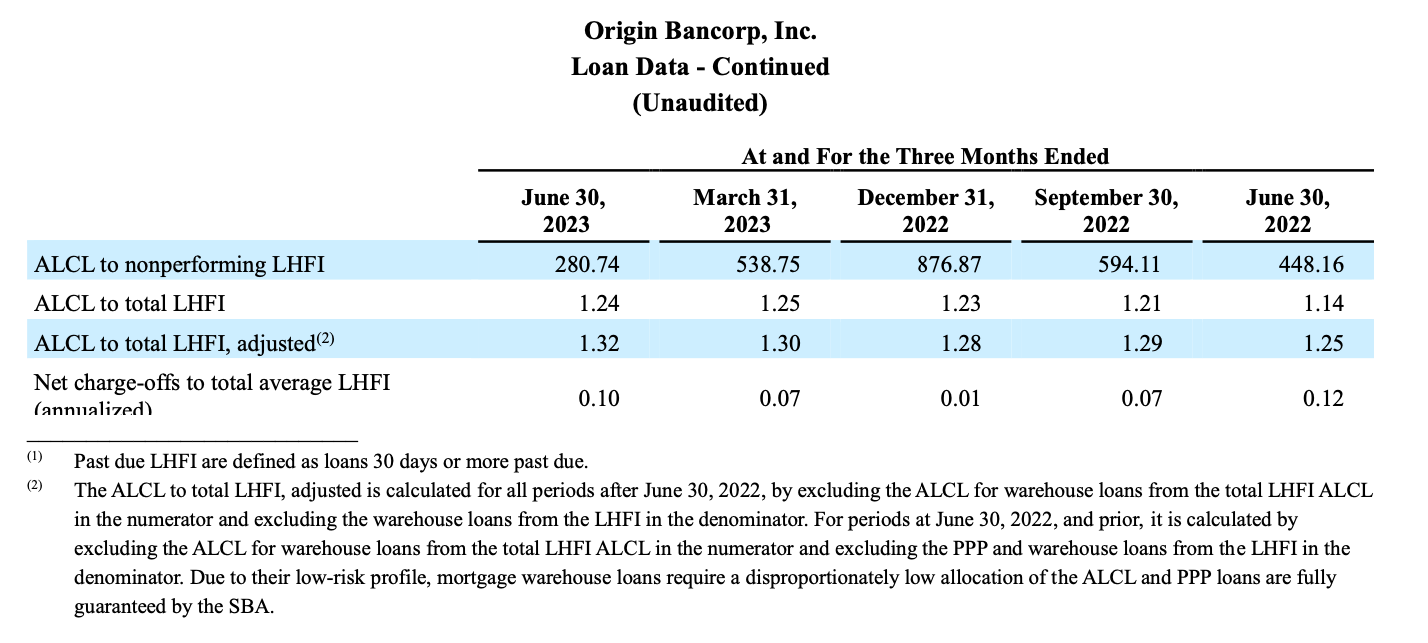
The ALCL to nonperforming LHFI decreased to 280.7% at June 30, 2023, compared to 538.8% at March 31, 2023, driven by an increase of $16.5 million in the Company’s nonperforming LHFI, offset by an increase of $2.3 million in the ALCL for the quarter. The $16.5 million increase in nonperforming LHFI at June 30, 2023, included $7.1 million from the reclassification of mortgage loans from the held for sale portfolio to the held for investment portfolio. While nonperforming LHFI to LHFI increased over the past quarter, the current level of 0.44% compares to levels of 0.41% and 0.48%, as of March 31, 2022, and December 31, 2021, respectively.
Past due LHFI increased $8.3 million to $19.8 million from $11.5 million for the linked quarter, primarily due to increases in past due commercial and industrial loans. On a percentage basis, past due LHFI to LHFI of 0.26%, compares favorably to levels of 0.42% and 0.49%, as of March 31, 2022, and December 31, 2021, respectively. Classified loans decreased $1.9 million at June 30, 2023, compared to the linked quarter, and represented 1.11% of LHFI at June 30, 2023, compared to 1.17% at March 31, 2023.
Noninterest Income
Noninterest income for the quarter ended June 30, 2023, was $15.6 million, a decrease of $748,000, or 4.6%, from the linked quarter. The decrease from the linked quarter was primarily driven by decreases of $826,000 and $379,000 on insurance commission and fee income and mortgage banking revenue, respectively. These decreases were partially offset by a $484,000 increase in other noninterest income.
The decrease in insurance commission and fee income was primarily driven by seasonality, as there is typically higher annual contingency fee income in the first quarter of each year.
The decrease in mortgage banking revenue was primarily due to decreased mortgage production during the current quarter, compared to the linked quarter.
The increase in other noninterest income was due to a $471,000 gain realized from repurchasing, at a discount, $5.0 million in the Company’s subordinated promissory notes from the FDIC through its failed bank operation process.
Noninterest Expense
Noninterest expense for the quarter ended June 30, 2023, was $58.9 million, an increase of $2.1 million, or 3.7%, compared to the linked quarter. The increase from the linked quarter was primarily due to increases of $802,000, $781,000 and $413,000 in salaries and employee benefit, regulatory assessments and office and operations expenses, respectively.
The increase in salaries and employee benefit expense was primarily driven by nine new positions added to the Company’s mortgage group, including the Litton mortgage team.
The increase in regulatory assessment expense was due to an 192 basis point increase in the FDIC’s Uniform Assessment rate which negatively impacted the Company’s regulatory expenses.
The increase in office and operations expense was due to higher business development expenses incurred during the current quarter.
Income Taxes
The effective tax rate was 21.5% during the quarter ended June 30, 2023, compared to 20.5% during the linked quarter and 18.4% during the quarter ended June 30, 2022. The effective tax rate for the current quarter was higher due to increased state tax compared to the linked quarter and the quarter ended June 30, 2022.
Financial Condition
Loans
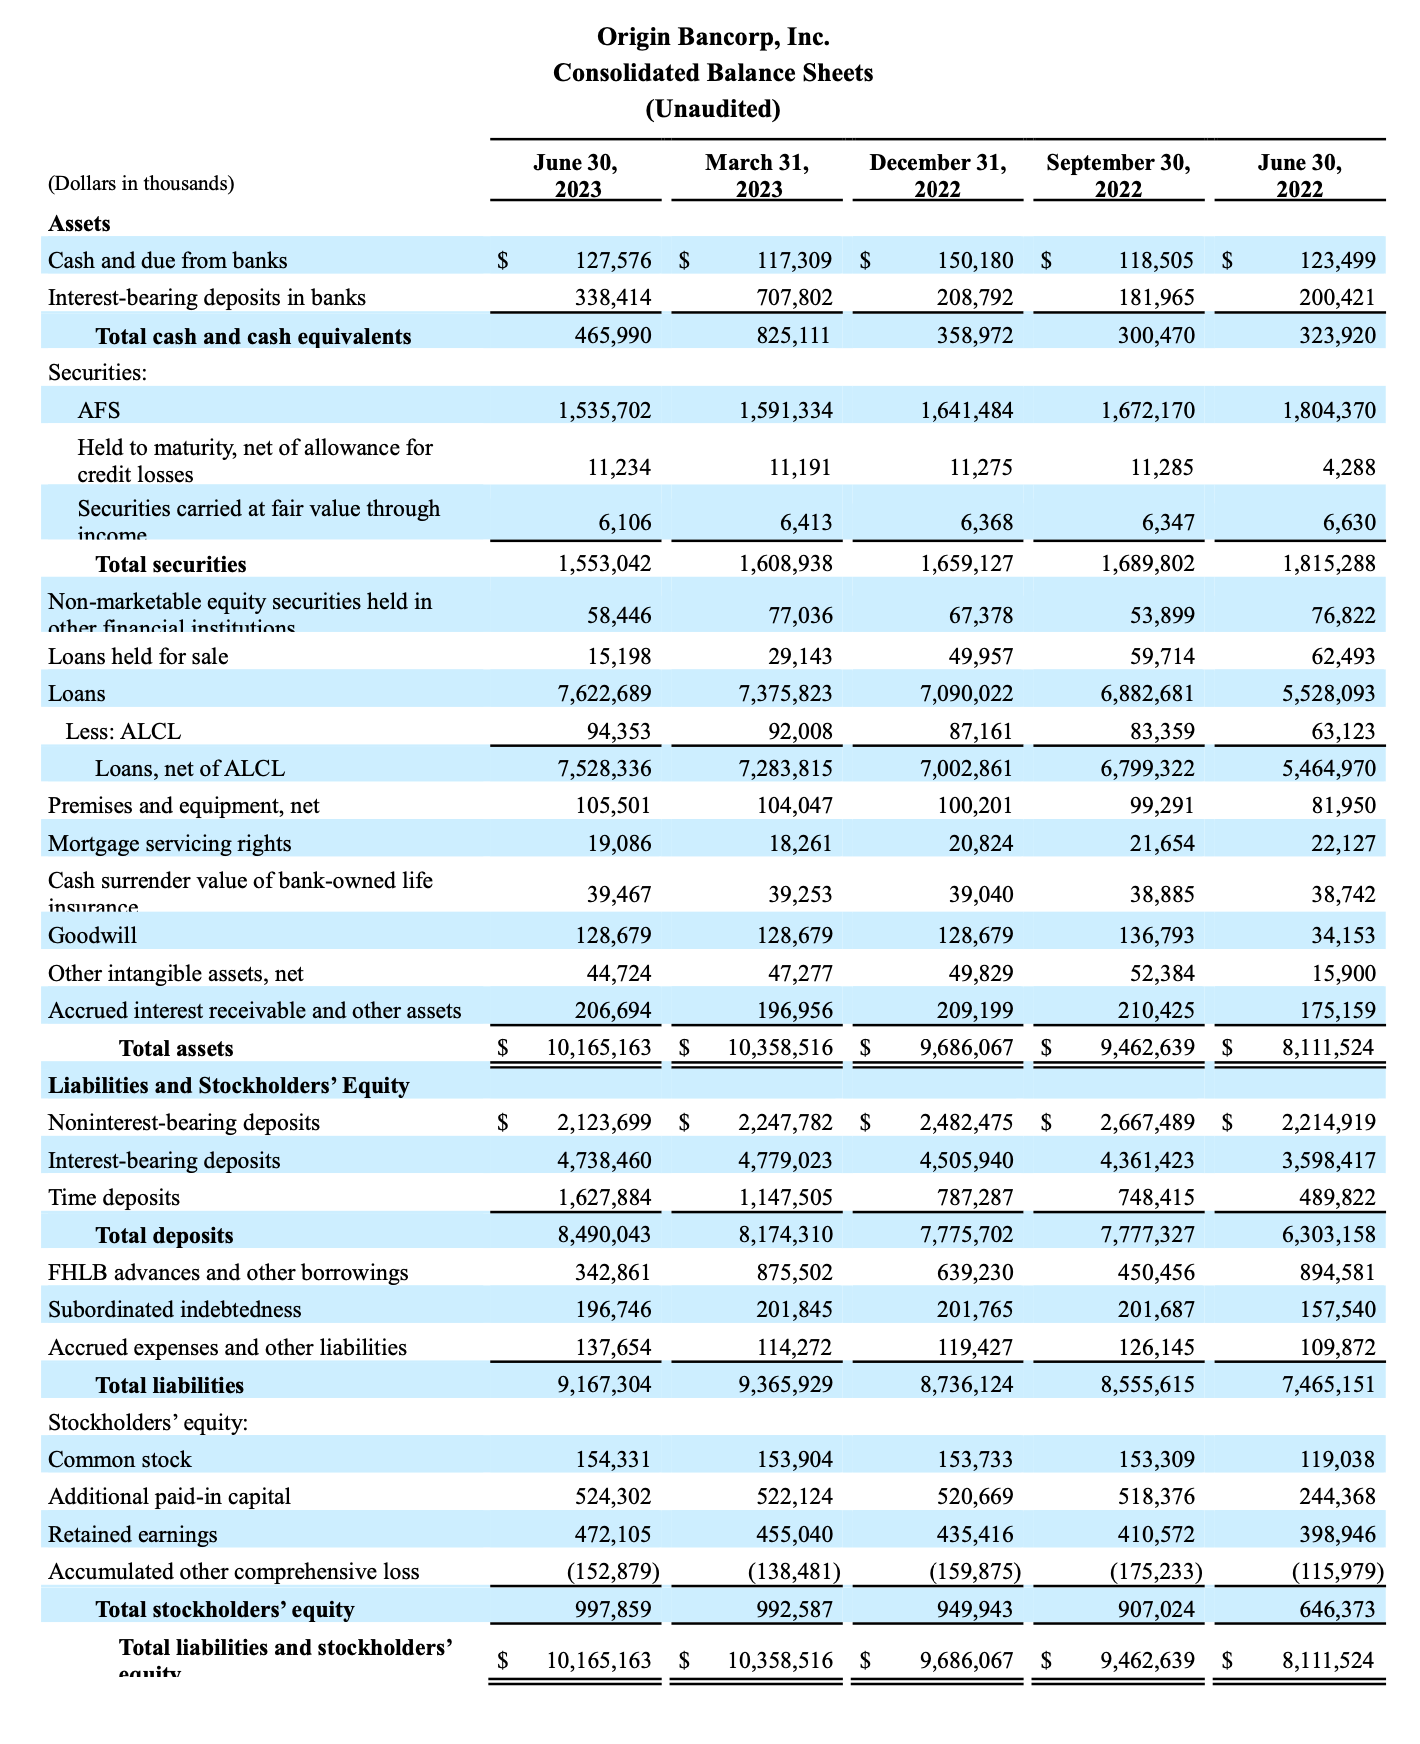
• Total LHFI at June 30, 2023, were $7.62 billion, an increase of $246.9 million, or 3.3%, from $7.38 billion at March 31, 2023, and an increase of $2.09 billion, or 37.9%, compared to June 30, 2022.
• Mortgage warehouse lines of credit totaled $537.6 million at June 30, 2023, an increase of $200.1 million, or 59.3%, compared to the linked quarter.
• Total real estate loans were $5.08 billion at June 30, 2023, an increase of $161.5 million, or 3.3%, from the linked quarter, with construction/land/land development loan growth contributing $73.6 million of the total real estate loan growth.
• Total commercial and industrial loans were $1.98 billion at June 30, 2023, a decrease of $114.1 million, or 5.5%, compared to the linked quarter.
Securities
• Total securities at June 30, 2023, were $1.55 billion, a decrease of $55.9 million, or 3.5%, compared to the linked quarter and a decrease of $262.2 million, or 14.4%, compared to June 30, 2022.
• The decrease was primarily due to maturities and calls, as well as normal principal paydowns, there were no sales of securities during the current quarter.
• Accumulated other comprehensive loss, net of taxes, primarily associated with the available for sale (“AFS”) portfolio, was $152.9 million at June 30, 2023, an increase of $14.4 million from the linked quarter.
• The weighted average effective duration for the total securities portfolio was 4.13 years as of June 30, 2023, compared to 4.17 years as of March 31, 2023.
Deposits
• Total deposits at June 30, 2023, were $8.49 billion, an increase of $315.7 million, or 3.9%, compared to the linked quarter, and represented an increase of $2.19 billion, or 34.7%, from June 30, 2022.
• The increase in the current quarter compared to the linked quarter was primarily due to increases of $387.9 million and $92.4 million in brokered deposits and non-brokered time deposits, respectively, which was partially offset by a $124.1 million decrease in noninterest-bearing deposits.
• At June 30, 2023, noninterest-bearing deposits as a percentage of total deposits were 25.0%, compared to 27.5% and 35.1% at March 31, 2023, and June 30, 2022, respectively.
• Uninsured/uncollateralized deposits totaled $2.84 billion at June 30, 2023, compared to $3.09 billion at March 31, 2023, representing 33.4% and 37.8% of total deposits at June 30, 2023 and March 31, 2023, respectively.
Borrowings
• FHLB advances and other borrowings at June 30, 2023, were $342.9 million, a decrease of $532.6 million, or 60.8%, compared to the linked quarter and represented a decrease of $551.7 million, or 61.7%, from June 30, 2022. The decrease was primarily due to the repayment of approximately $700.0 million in excess contingency liquidity borrowed during March 2023 and held for the majority of the quarter ended June 30, 2023.
• Average FHLB advances were $599.2 million for the quarter ended June 30, 2023, an increase of $167.0 million, or 38.6%, from $432.2 million for the quarter ended March 31, 2023 and an increase of $189.3 million, or 46.2%, from June 30, 2022.
Stockholders’ Equity
• Stockholders’ equity was $997.9 million at June 30, 2023, an increase of $5.3 million, or 0.5%, compared to $992.6 million at March 31, 2023, and an increase of $351.5 million, or 54.4%, compared to $646.4 million, at June 30, 2022.
• The increase in stockholders’ equity from the linked quarter is primarily due to net income of $21.8 million, partially offset by an increase in accumulated other comprehensive loss, net of tax, of $14.4 million and dividends declared of $4.7 million during the current quarter.
Conference Call
Origin will hold a conference call to discuss its second quarter 2023 results on Thursday, July 27, 2023, at 8:00 a.m. Central Time (9:00 a.m. Eastern Time). To participate in the live conference call, please dial +1 (929) 272-1574 (U.S. Local / International 1); +1 (857) 999-3259 (U.S. Local / International 2); +1 (800) 528-1066 (U.S. Toll Free), enter Conference ID: 35632 and request to be joined into the Origin Bancorp, Inc. (OBK) call. A simultaneous audio-only webcast may be accessed via Origin’s website at www.origin.bank under the investor relations, News & Events, Events & Presentations link or directly by visiting https://dealroadshow.com/e/ORIGINQ223.
If you are unable to participate during the live webcast, the webcast will be archived on the Investor Relations section of Origin’s website at www.origin.bank, under Investor Relations, News & Events, Events & Presentations.
About Origin
Origin Bancorp, Inc. is a financial holding company headquartered in Ruston, Louisiana. Origin’s wholly owned bank subsidiary, Origin Bank, was founded in 1912 in Choudrant, Louisiana. Deeply rooted in Origin’s history is a culture committed to providing personalized, relationship banking to businesses, municipalities, and personal clients to enrich the lives of the people in the communities it serves. Origin provides a broad range of financial services and currently operates 61 banking centers located in Dallas/Fort Worth, East Texas, Houston, North Louisiana and Mississippi. For more information, visit www.origin.bank.
Non-GAAP Financial Measures
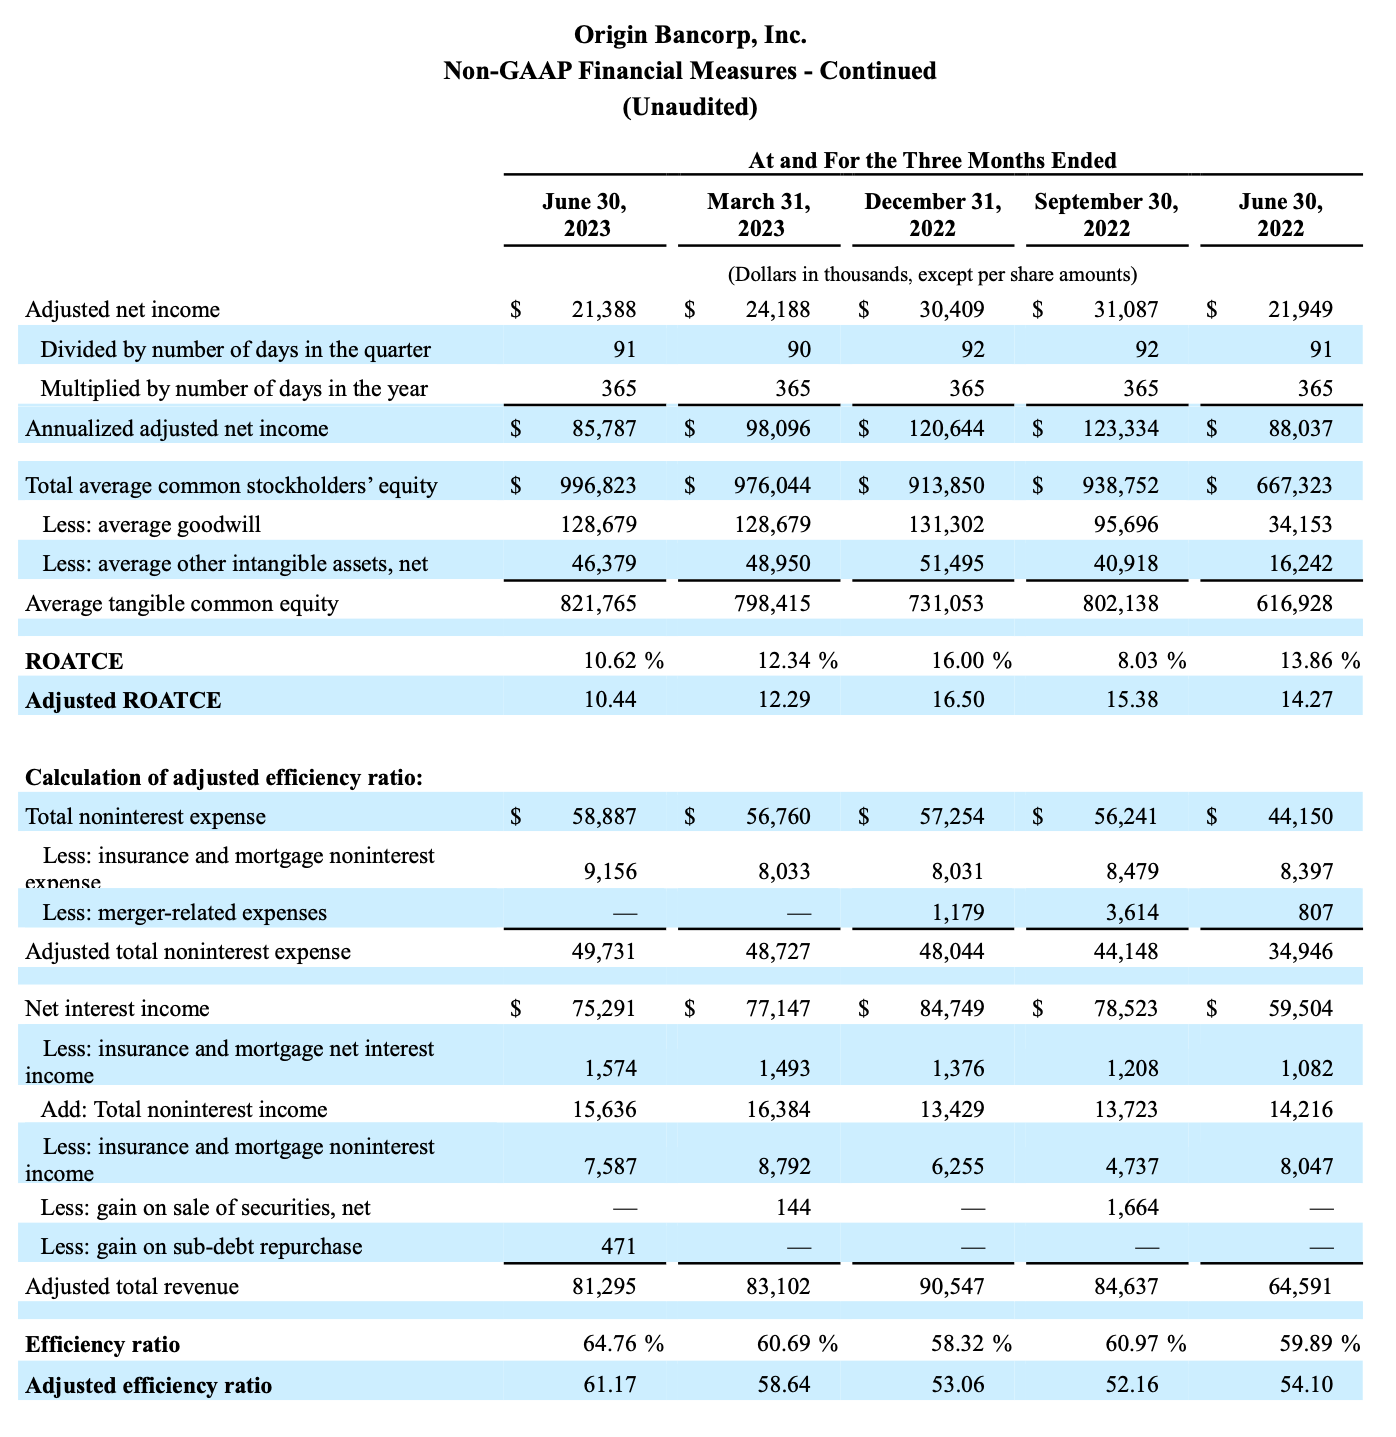
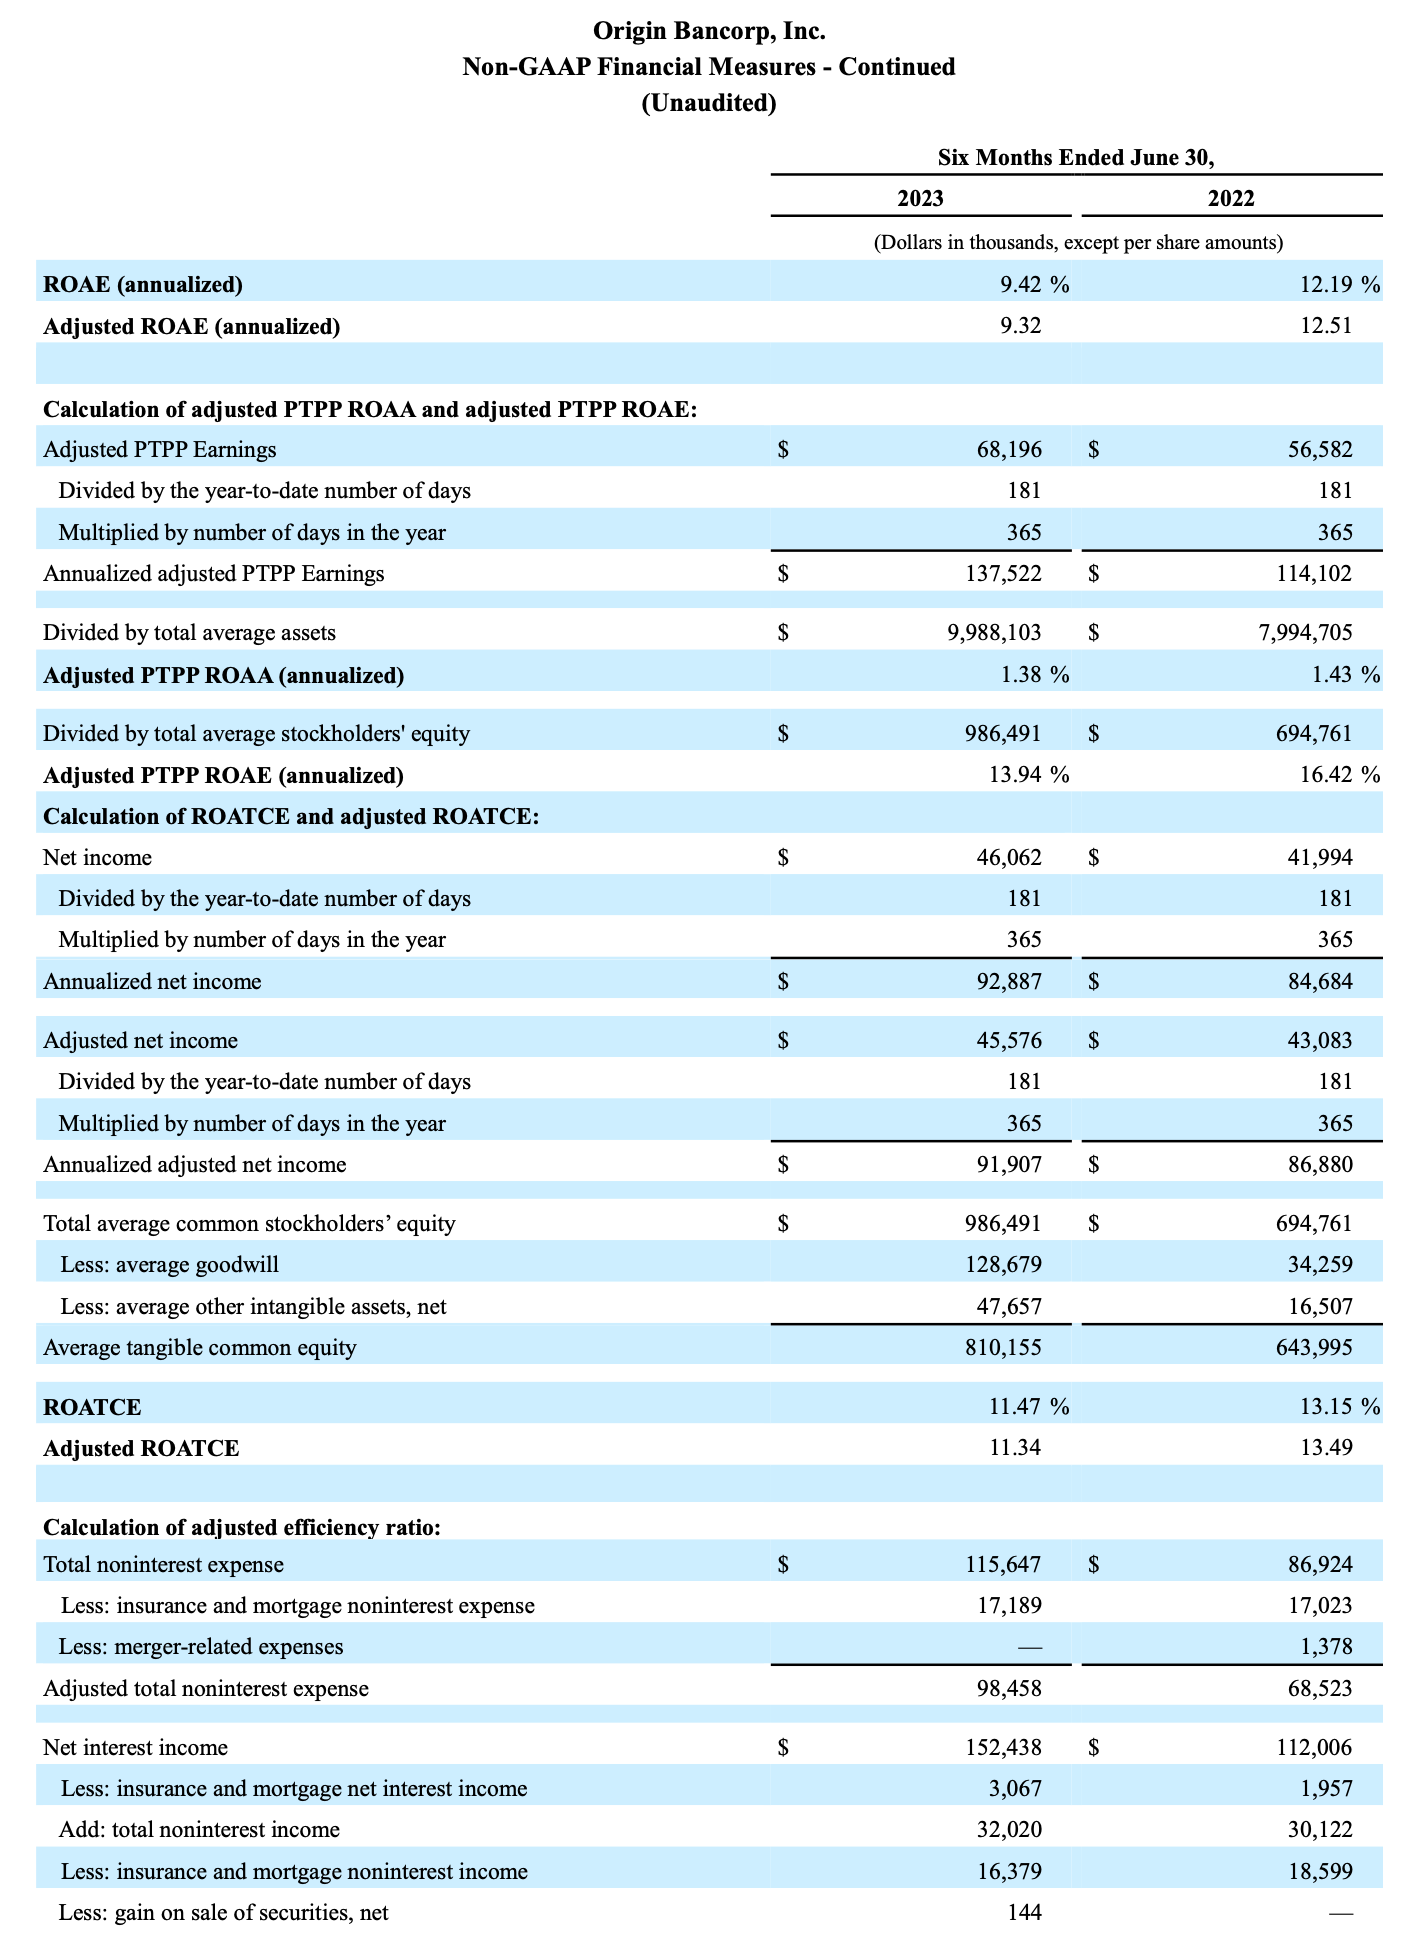
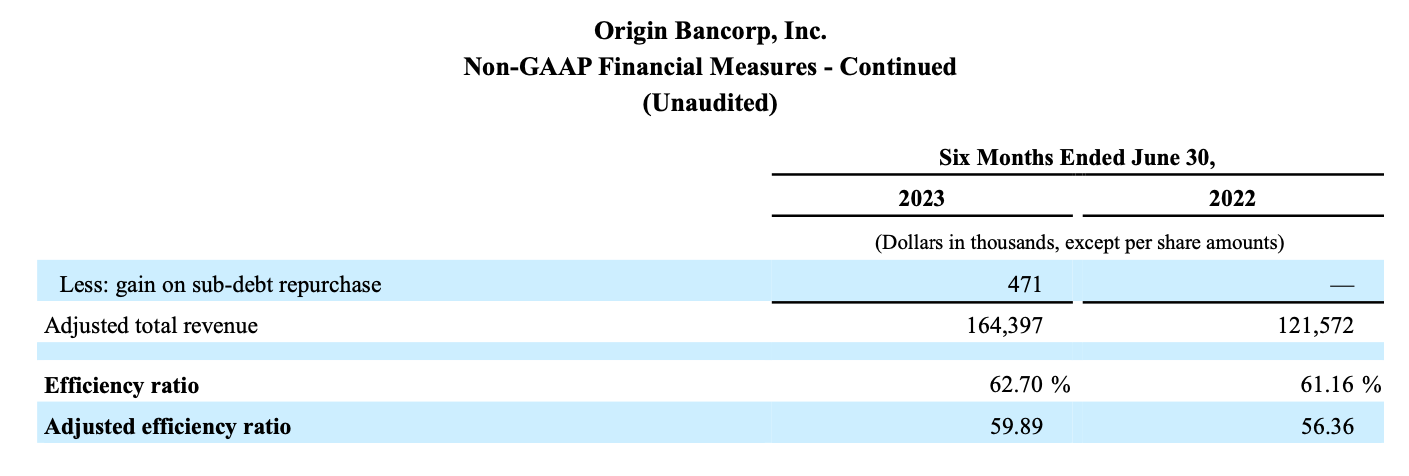
Origin reports its results in accordance with generally accepted accounting principles in the United States of America ("GAAP"). However, management believes that certain supplemental non-GAAP financial measures may provide meaningful information to investors that is useful in understanding Origin's results of operations and underlying trends in its business. However, non-GAAP financial measures are supplemental and should be viewed in addition to, and not as an alternative for, Origin's reported results prepared in accordance with GAAP. The following are the non-GAAP measures used in this release: adjusted net income, adjusted PTPP earnings, adjusted diluted EPS, NIM-FTE, adjusted, adjusted ROAA, adjusted PTPP ROAA, adjusted ROAE, adjusted PTPP ROAE, tangible book value per common share, adjusted tangible book value per common share, tangible common equity to tangible assets, ROATCE, adjusted ROATCE and adjusted efficiency ratio.
Please see the last few pages of this release for reconciliations of non-GAAP measures to the most directly comparable financial measures calculated in accordance with GAAP.
Forward-Looking Statements
This press release contains certain forward-looking statements within the meaning of the Private Securities Litigation Reform Act of 1995. Forward-looking statements include information regarding Origin’s future financial performance, business and growth strategies, projected plans and objectives, and any expected purchases of its outstanding common stock, and related transactions and other projections based on macroeconomic and industry trends, including changes to interest rates by the Federal Reserve and the resulting impact on Origin’s results of operations, estimated forbearance amounts and expectations regarding the Company’s liquidity, including in connection with advances obtained from the FHLB, which are all subject to change and may be inherently unreliable due to the multiple factors that impact broader economic and industry trends, and any such changes may be material. Such forward-looking statements are based on various facts and derived utilizing important assumptions and current expectations, estimates and projections about Origin and its subsidiaries, any of which may change over time and some of which may be beyond Origin’s control. Statements or statistics preceded by, followed by or that otherwise include the words “assumes,” “anticipates,” “believes,” “estimates,” “expects,” “foresees,” “intends,” “plans,” “projects,” and similar expressions or future or conditional verbs such as “could,” “may,” “might,” “should,” “will,” and “would” and variations of such terms are generally forward-looking in nature and not historical facts, although not all forward- looking statements include the foregoing words. Further, certain factors that could affect Origin’s future results and cause actual results to differ materially from those expressed in the forward-looking statements include, but are not limited to: potential impacts of the recent adverse developments in the banking industry highlighted by high-profile bank failures, including impacts on customer confidence, deposit outflows, liquidity and the regulatory response thereto; the impact of current and future economic conditions generally and in the financial services industry, nationally and within Origin’s primary market areas, including the effects of declines in the real estate market, high unemployment rates, inflationary pressures, elevated interest rates and slowdowns in economic growth, as well as the financial stress on borrowers and changes to customer and client behavior as a result of the foregoing; deterioration of Origin’s asset quality; factors that can impact the performance of Origin’s loan portfolio, including real estate values and liquidity in Origin’s primary market areas; the financial health of Origin’s commercial borrowers and the success of construction projects that Origin finances; changes in the value of collateral securing Origin’s loans; developments in our mortgage banking business, including loan modifications, general demand, and the effects of judicial or regulatory requirements or guidance; Origin’s ability to anticipate interest rate changes and manage interest rate risk, (including the impact of higher interest rates on macroeconomic conditions, competition, and the cost of doing business); the effectiveness of Origin’s risk management framework and quantitative models; Origin’s inability to receive dividends from Origin Bank and to service debt, pay dividends to Origin’s common stockholders, repurchase Origin’s shares of common stock and satisfy obligations as they become due; the impact of labor pressures; changes in Origin’s operation or expansion strategy or Origin’s ability to prudently manage its growth and execute its strategy; changes in management personnel; Origin’s ability to maintain important customer relationships, reputation or otherwise avoid liquidity risks; increasing costs as Origin grows deposits; operational risks associated with Origin’s business; volatility and direction of market interest rates; significant turbulence or a disruption in the capital or financial markets and the effect of a fall in stock market prices on our investment securities; increased competition in the financial services industry, particularly from regional and national institutions, as well as from fintech companies; difficult market conditions and unfavorable economic trends in the United States generally, and particularly in the market areas in which Origin operates and in which its loans are concentrated; an increase in unemployment levels and slowdowns in economic growth; Origin’s level of nonperforming assets and the costs associated with resolving any problem loans including litigation and other costs; the credit risk associated with the substantial amount of commercial real estate, construction and land development, and commercial loans in Origin’s loan portfolio; changes in laws, rules, regulations, interpretations or policies relating to financial institutions, and potential expenses associated with complying with such regulations; periodic changes to the extensive body of accounting rules and best practices; further government intervention in the U.S. financial system; a deterioration of the credit rating for U.S. long-term sovereign debt or actions that the U.S. government may take to avoid exceeding the debt ceiling; compliance with governmental and regulatory requirements, including the Dodd-Frank Wall Street Reform and Consumer Protection Act and others relating to banking, consumer protection, securities, and tax matters; Origin’s ability to comply with applicable capital and liquidity requirements, including its ability to generate liquidity internally or raise capital on favorable terms, including continued access to the debt and equity capital markets; changes in the utility of Origin’s non-GAAP liquidity measurements and its underlying assumptions or estimates; uncertainty regarding the transition away from the London Interbank Offered Rate and the impact of any replacement alternatives such as the Secured Overnight Financing Rate on Origin’s business; possible changes in trade, monetary and fiscal policies, laws and regulations and other activities of governments, agencies and similar organizations; natural disasters and adverse weather events, acts of terrorism, an outbreak of hostilities (including the impacts related to or resulting from Russia's military action in Ukraine, including the imposition of additional sanctions and export controls, as well as the broader impacts to financial markets and the global macroeconomic and geopolitical environments), regional or national protests and civil unrest (including any resulting branch closures or property damage), widespread illness or public health outbreaks or other international or domestic calamities, and other matters beyond Origin’s control; the impact of generative artificial intelligence; and system failures, cybersecurity threats or security breaches and the cost of defending against them. For a discussion of these and other risks that may cause actual results to differ from expectations, please refer to the sections titled “Cautionary Note Regarding Forward-Looking Statements” and “Risk Factors” in Origin’s most recent Annual Report on Form 10-K filed with the Securities and Exchange Commission and any updates to those sections set forth in Origin’s subsequent Quarterly Reports on Form 10-Q and Current Reports on Form 8-K. If one or more events related to these or other risks or uncertainties materialize, or if Origin’s underlying assumptions prove to be incorrect, actual results may differ materially from what Origin anticipates. Accordingly, you should not place undue reliance on any forward-looking statements. Any forward-looking statement speaks only as of the date on which it is made, and Origin does not undertake any obligation to publicly update or review any forward-looking statement, whether as a result of new information, future developments or otherwise.
New risks and uncertainties arise from time to time, and it is not possible for Origin to predict those events or how they may affect Origin. In addition, Origin cannot assess the impact of each factor on Origin’s business or the extent to which any factor, or combination of factors, may cause actual results to differ materially from those contained in any forward-looking statements. All forward-looking statements, expressed or implied, included in this communication are expressly qualified in their entirety by this cautionary statement. This cautionary statement should also be considered in connection with any subsequent written or oral forward-looking statements that Origin or persons acting on Origin’s behalf may issue. Annualized, pro forma, adjusted, projected, and estimated numbers are used for illustrative purposes only, are not forecasts, and may not reflect actual results.
Contact:
Investor Relations
Chris Reigelman, 318-497-3177, chris@origin.bank
Media Contact
Ryan Kilpatrick, 318-232-7472, rkilpatrick@origin.bank